

Oakville, ON Real Estate Market Stats: August 2026
Here's a full breakdown of Oakville's housing market for August 2026, average and median sold prices by property type, active detached listings, benchmark price history, and year-over-year trends.
August 2026, by property type
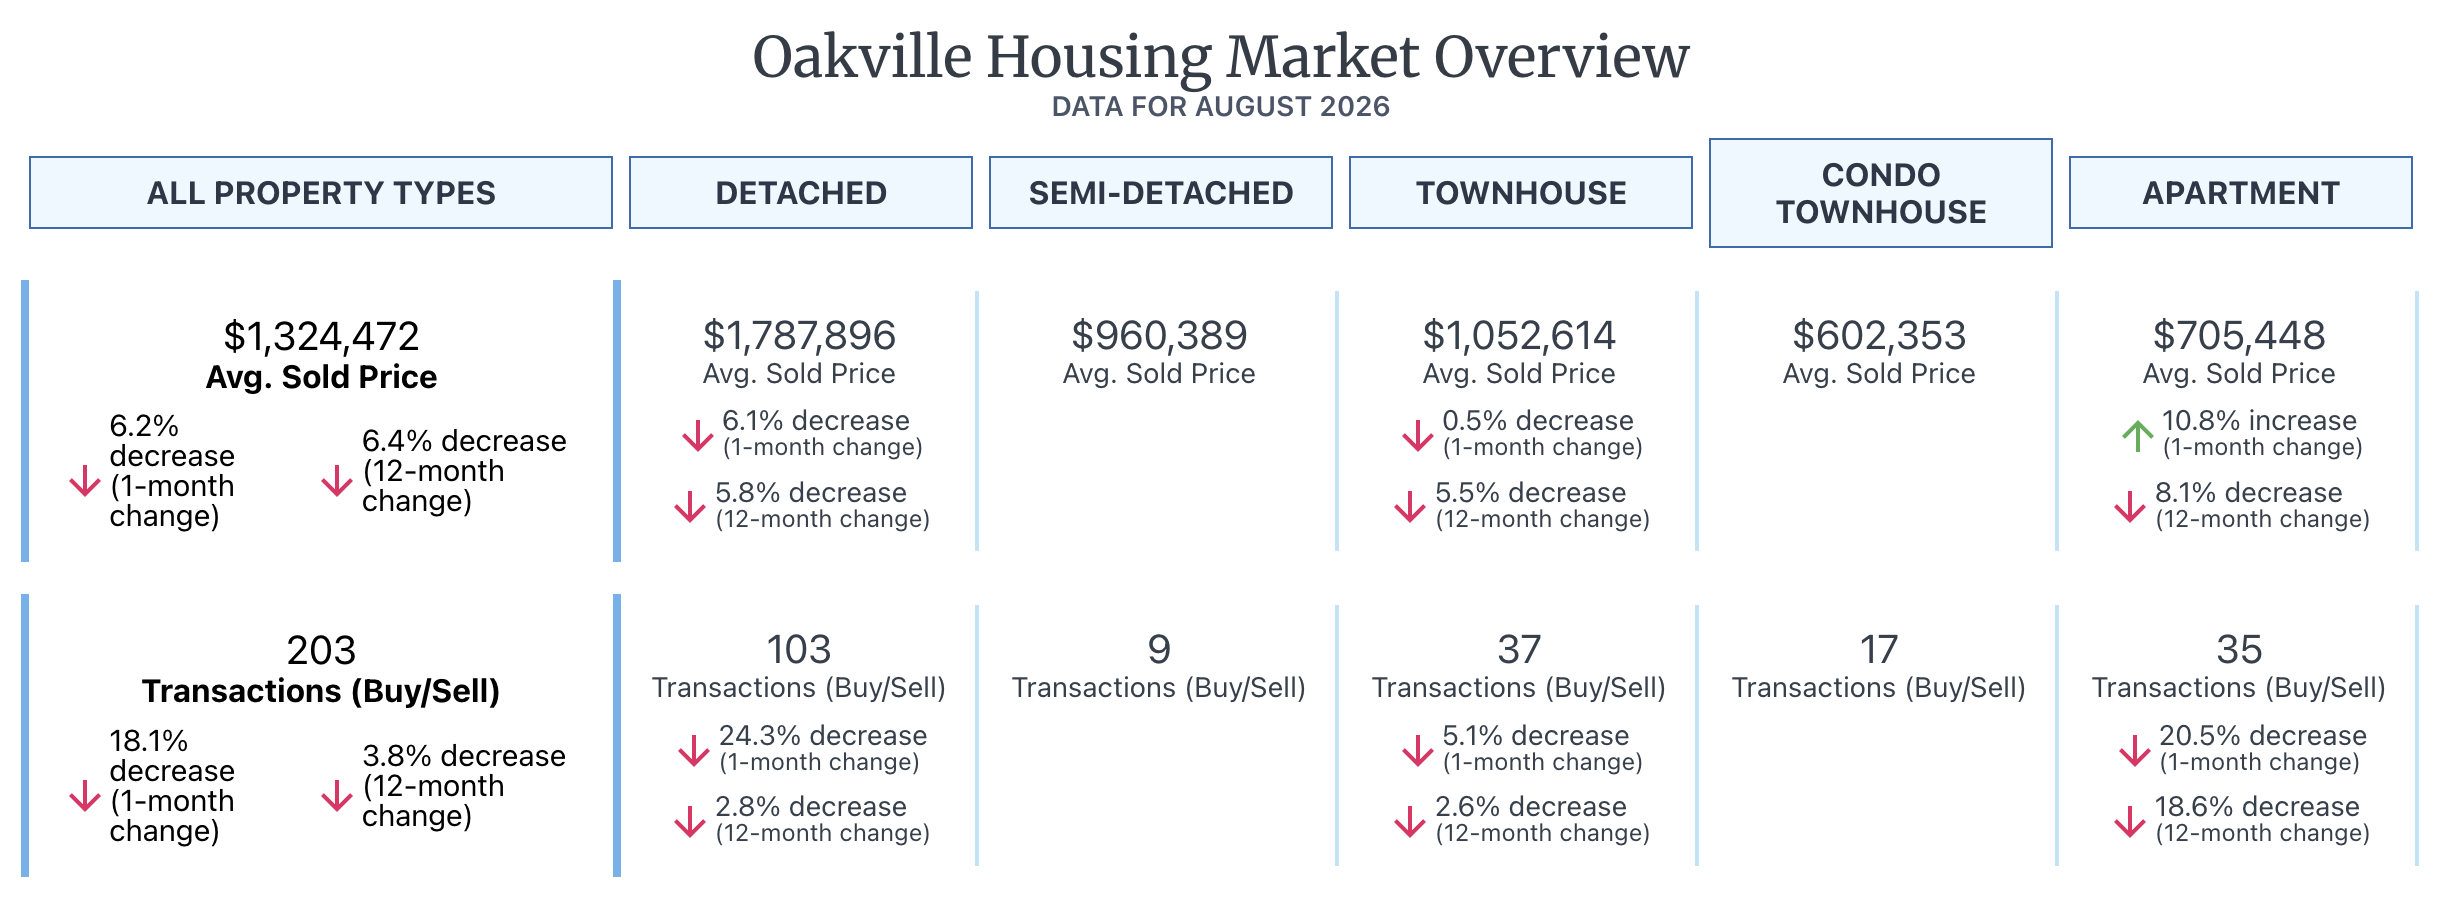
Detached, a closer look
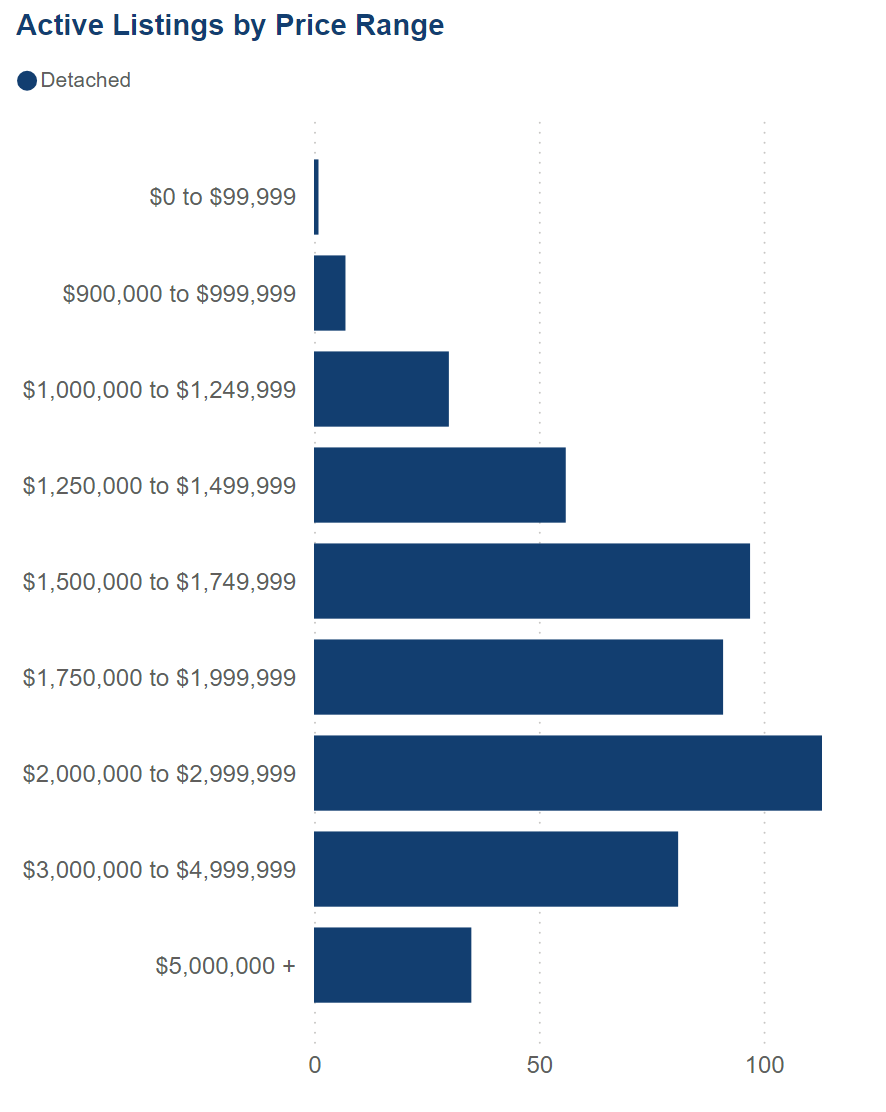
There are currently 511 active detached listings in Oakville, averaging $2,645,428 with a median list price of $1,949,999. Homes are sitting on the market for 52 days on average.
For August sales specifically: average price was $1,783,274, median $1,600,000, on 103 transactions. 8.7% of detached sales went above asking, with a median sale-to-list ratio of 95%. Total dollar volume for the month was $183,677,244.
Where detached buyers are shopping
The busiest price bands for active detached listings are $2 million to $3 million and $1.5 million to $1.75 million, with meaningful activity continuing all the way up through $3 million to $5 million.
Benchmark prices vs. 2021
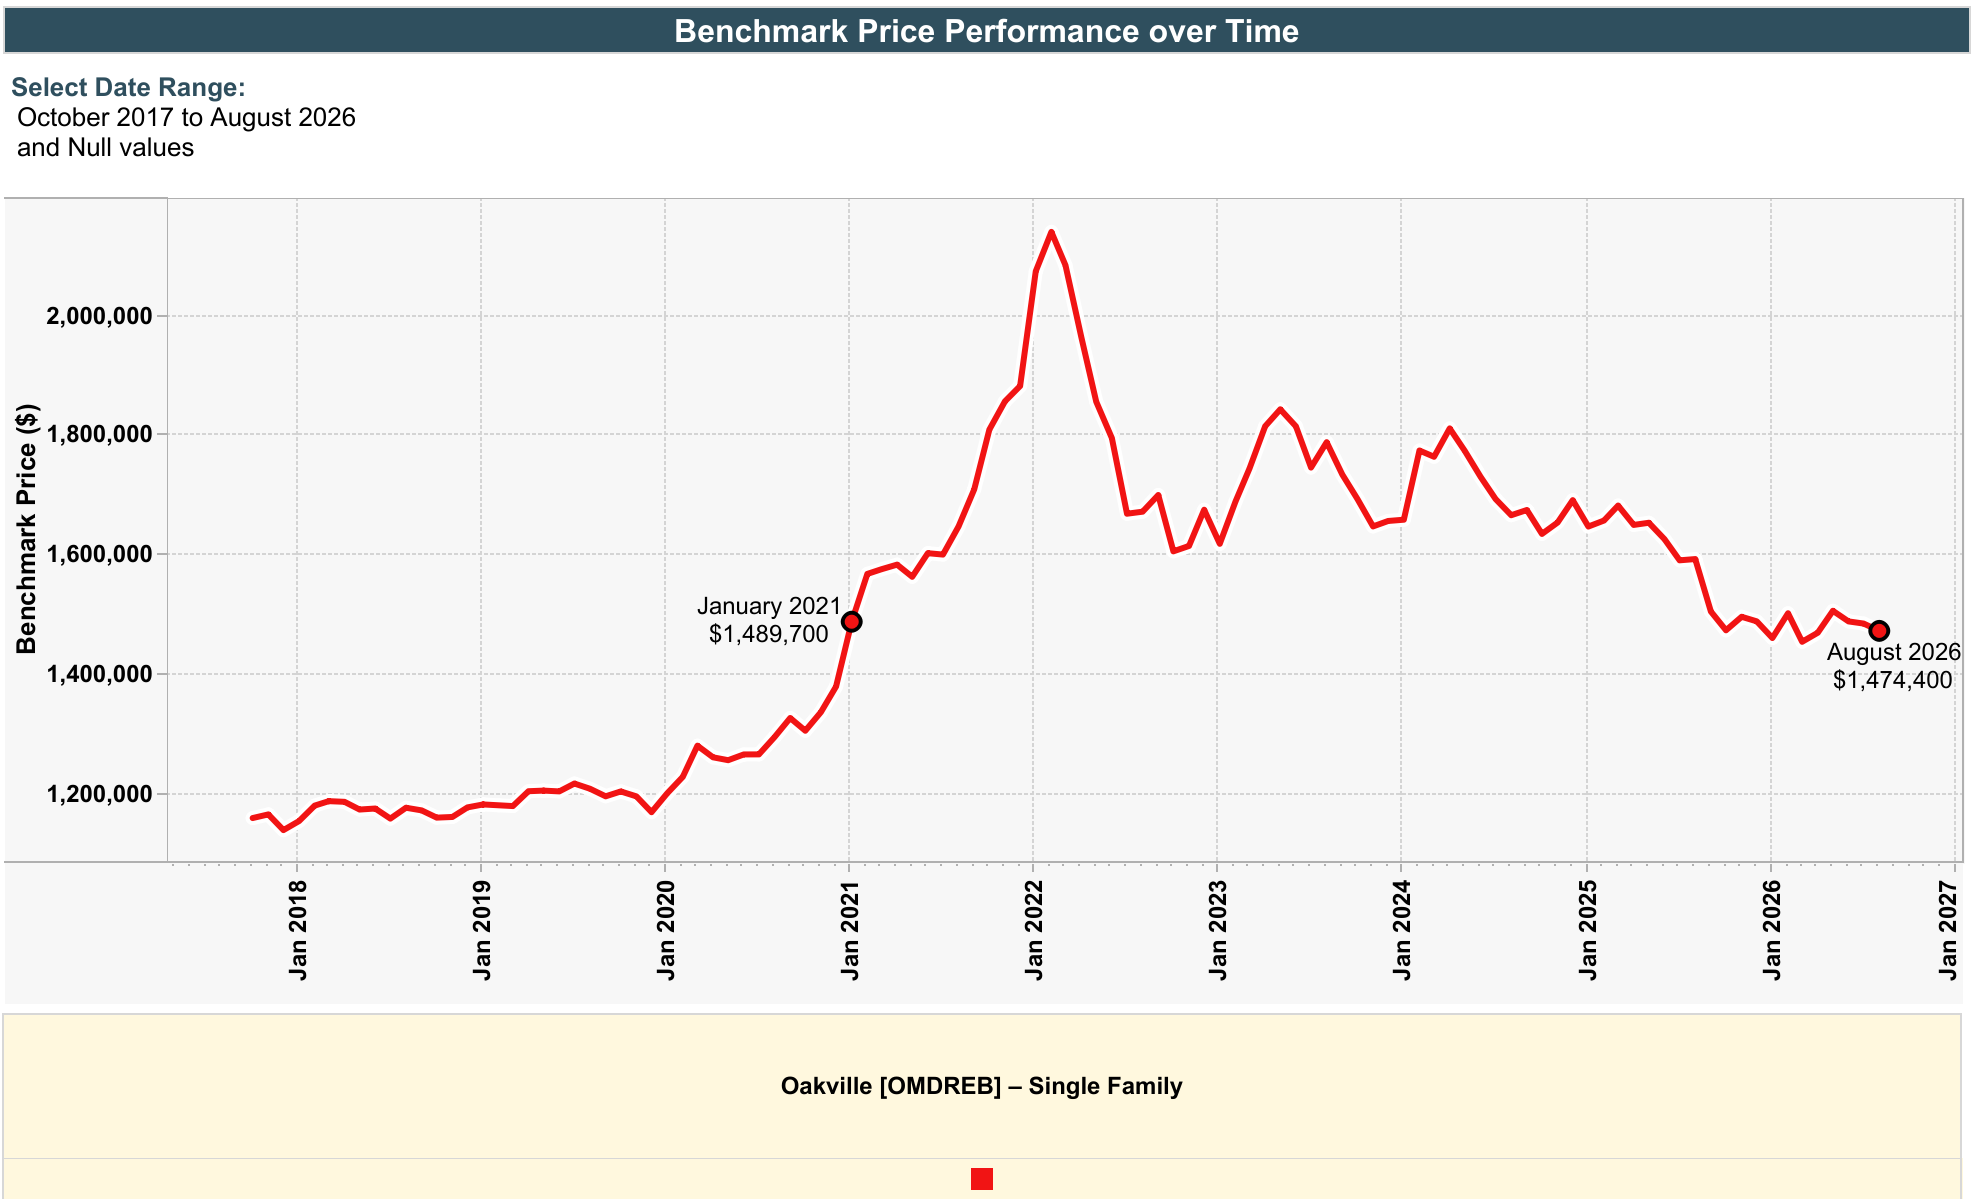
Oakville's single-family benchmark price was $1,489,700 in January 2021. Today it's $1,474,400, essentially back to that level after the 2022 spike above $2.1 million and the pullback that followed.
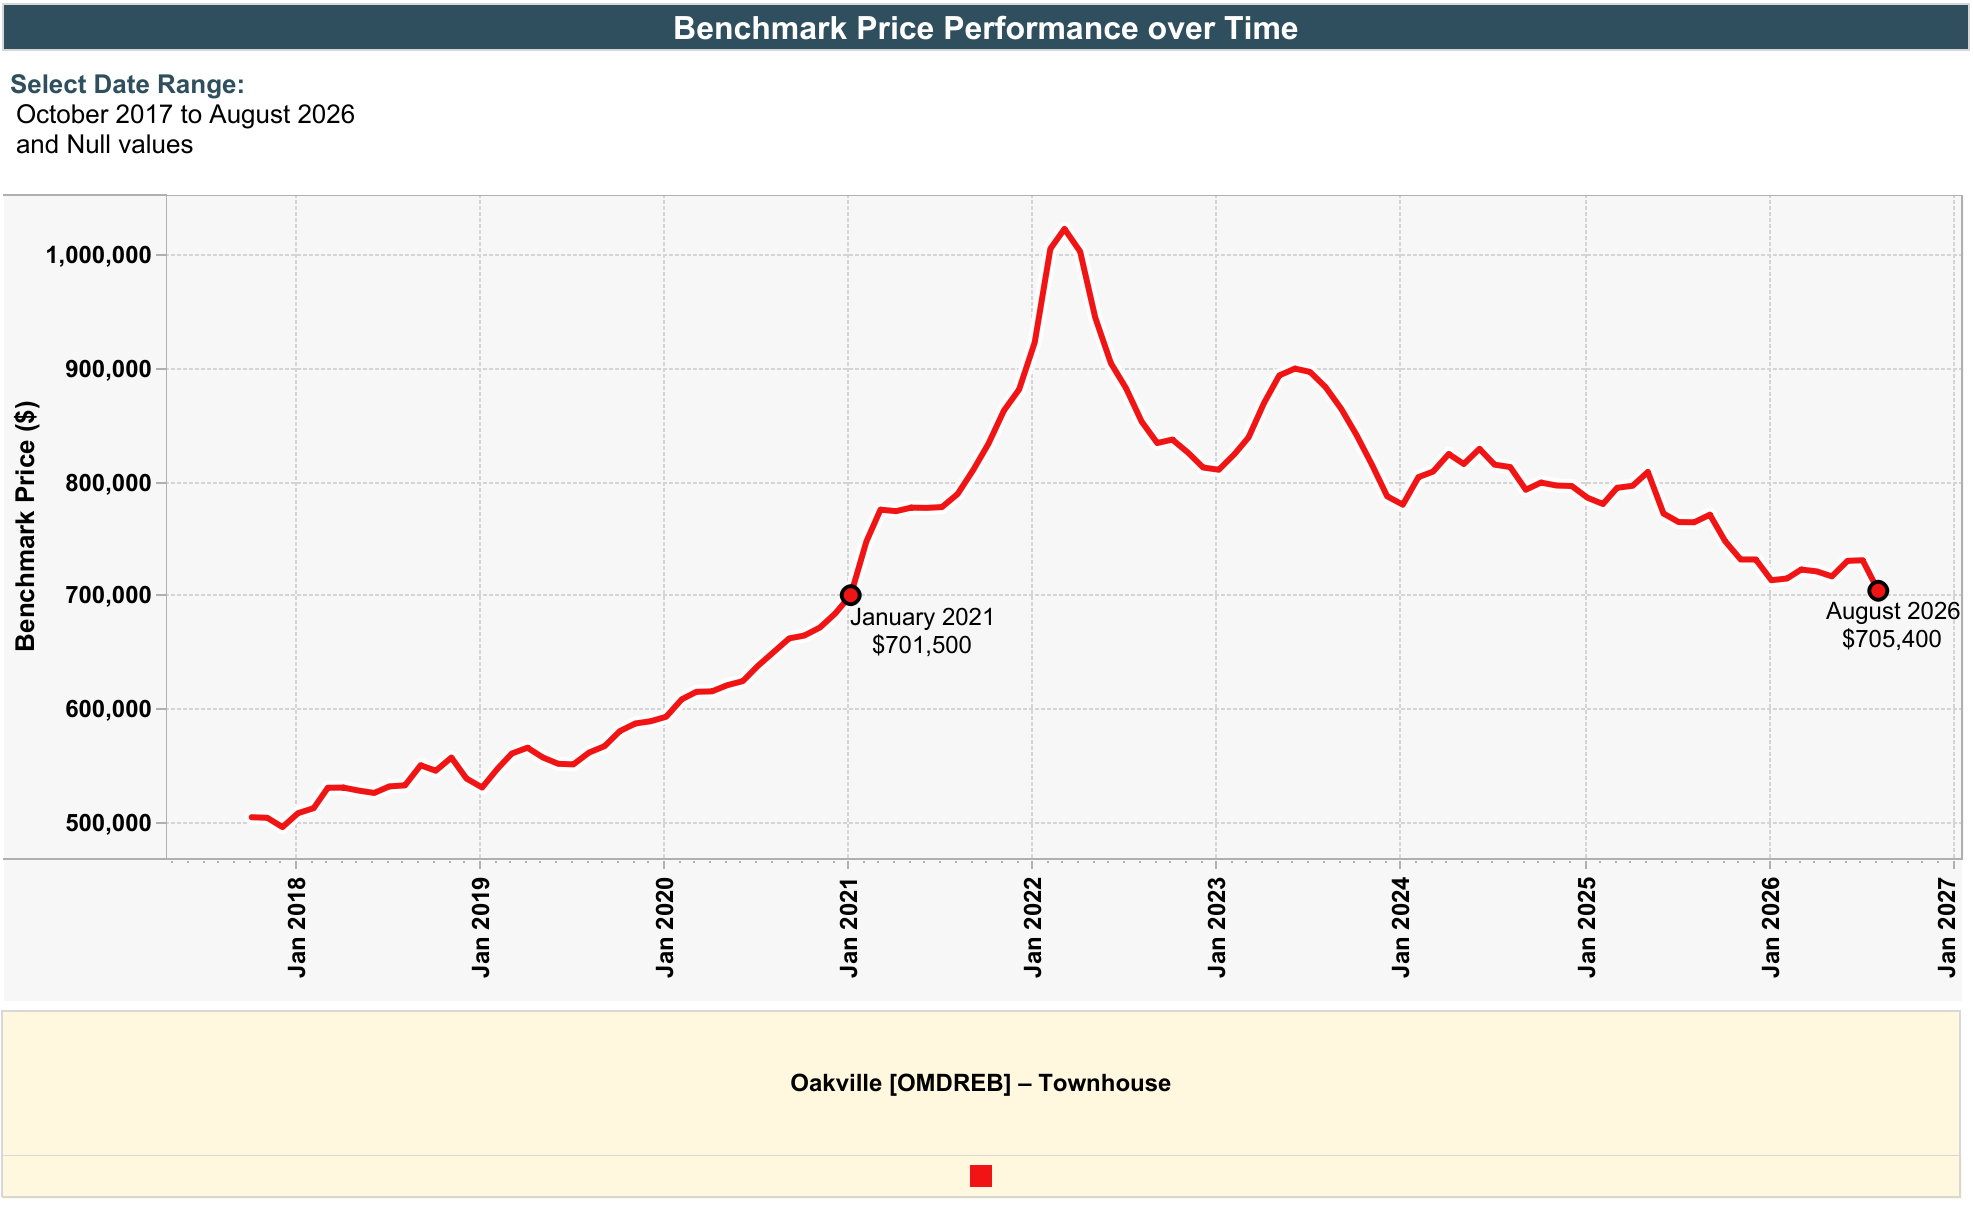
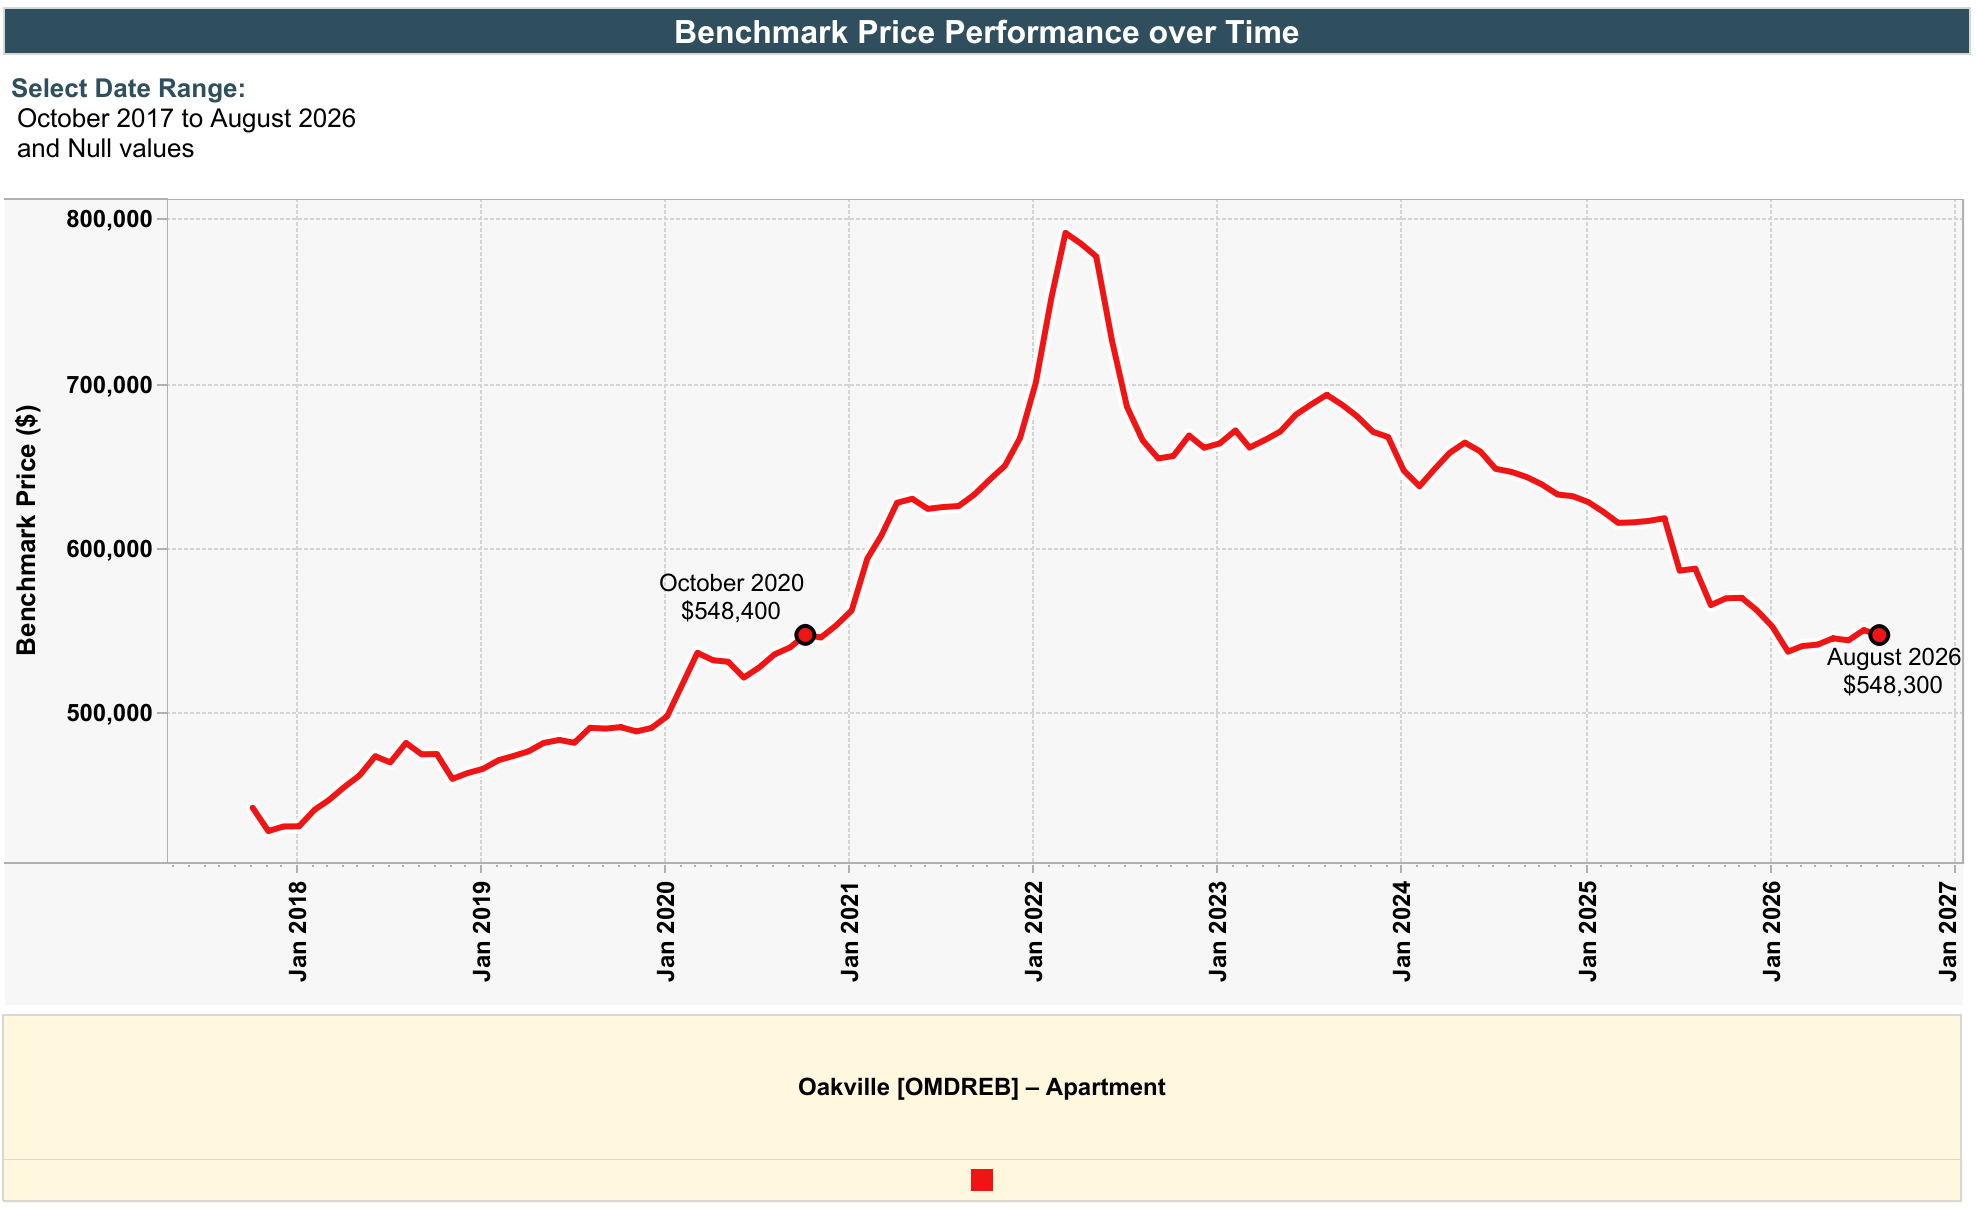
Townhouse benchmark: $701,500 in January 2021, $705,400 today. Apartment benchmark: $548,400 in October 2020, $548,300 today. All three property types are sitting close to where they started before the run-up.
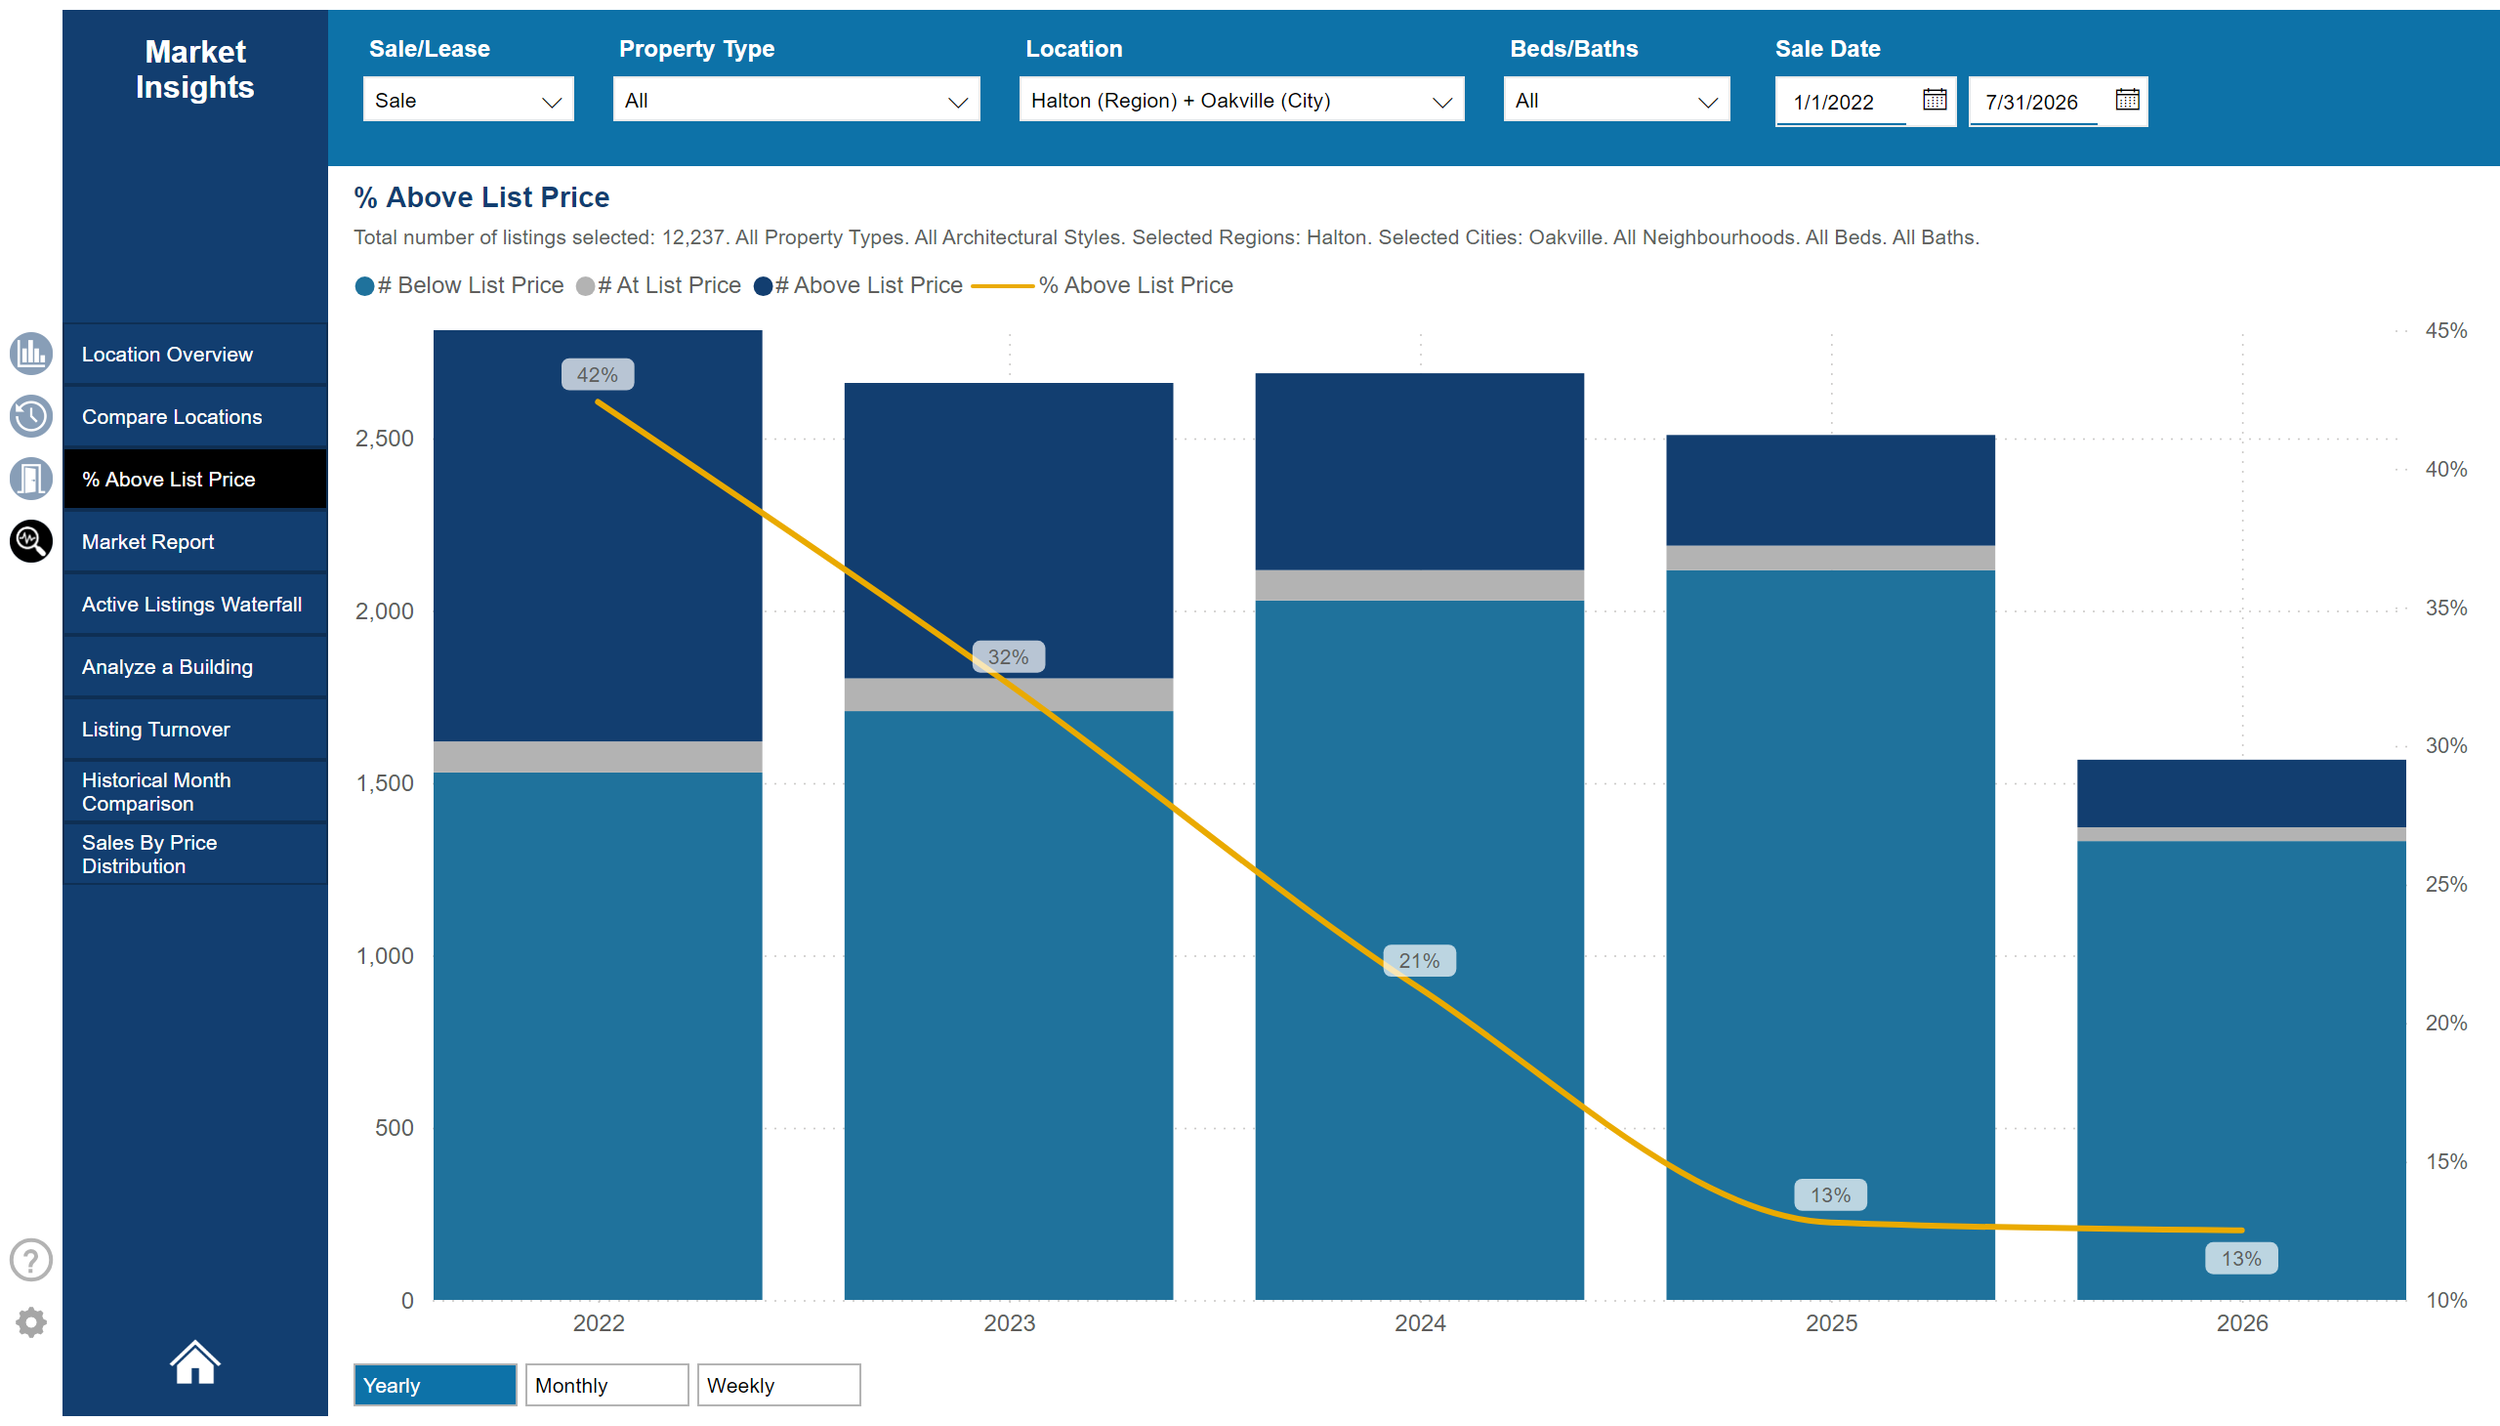
Bidding Wars by year
The Stat to Watch! Average down, median up
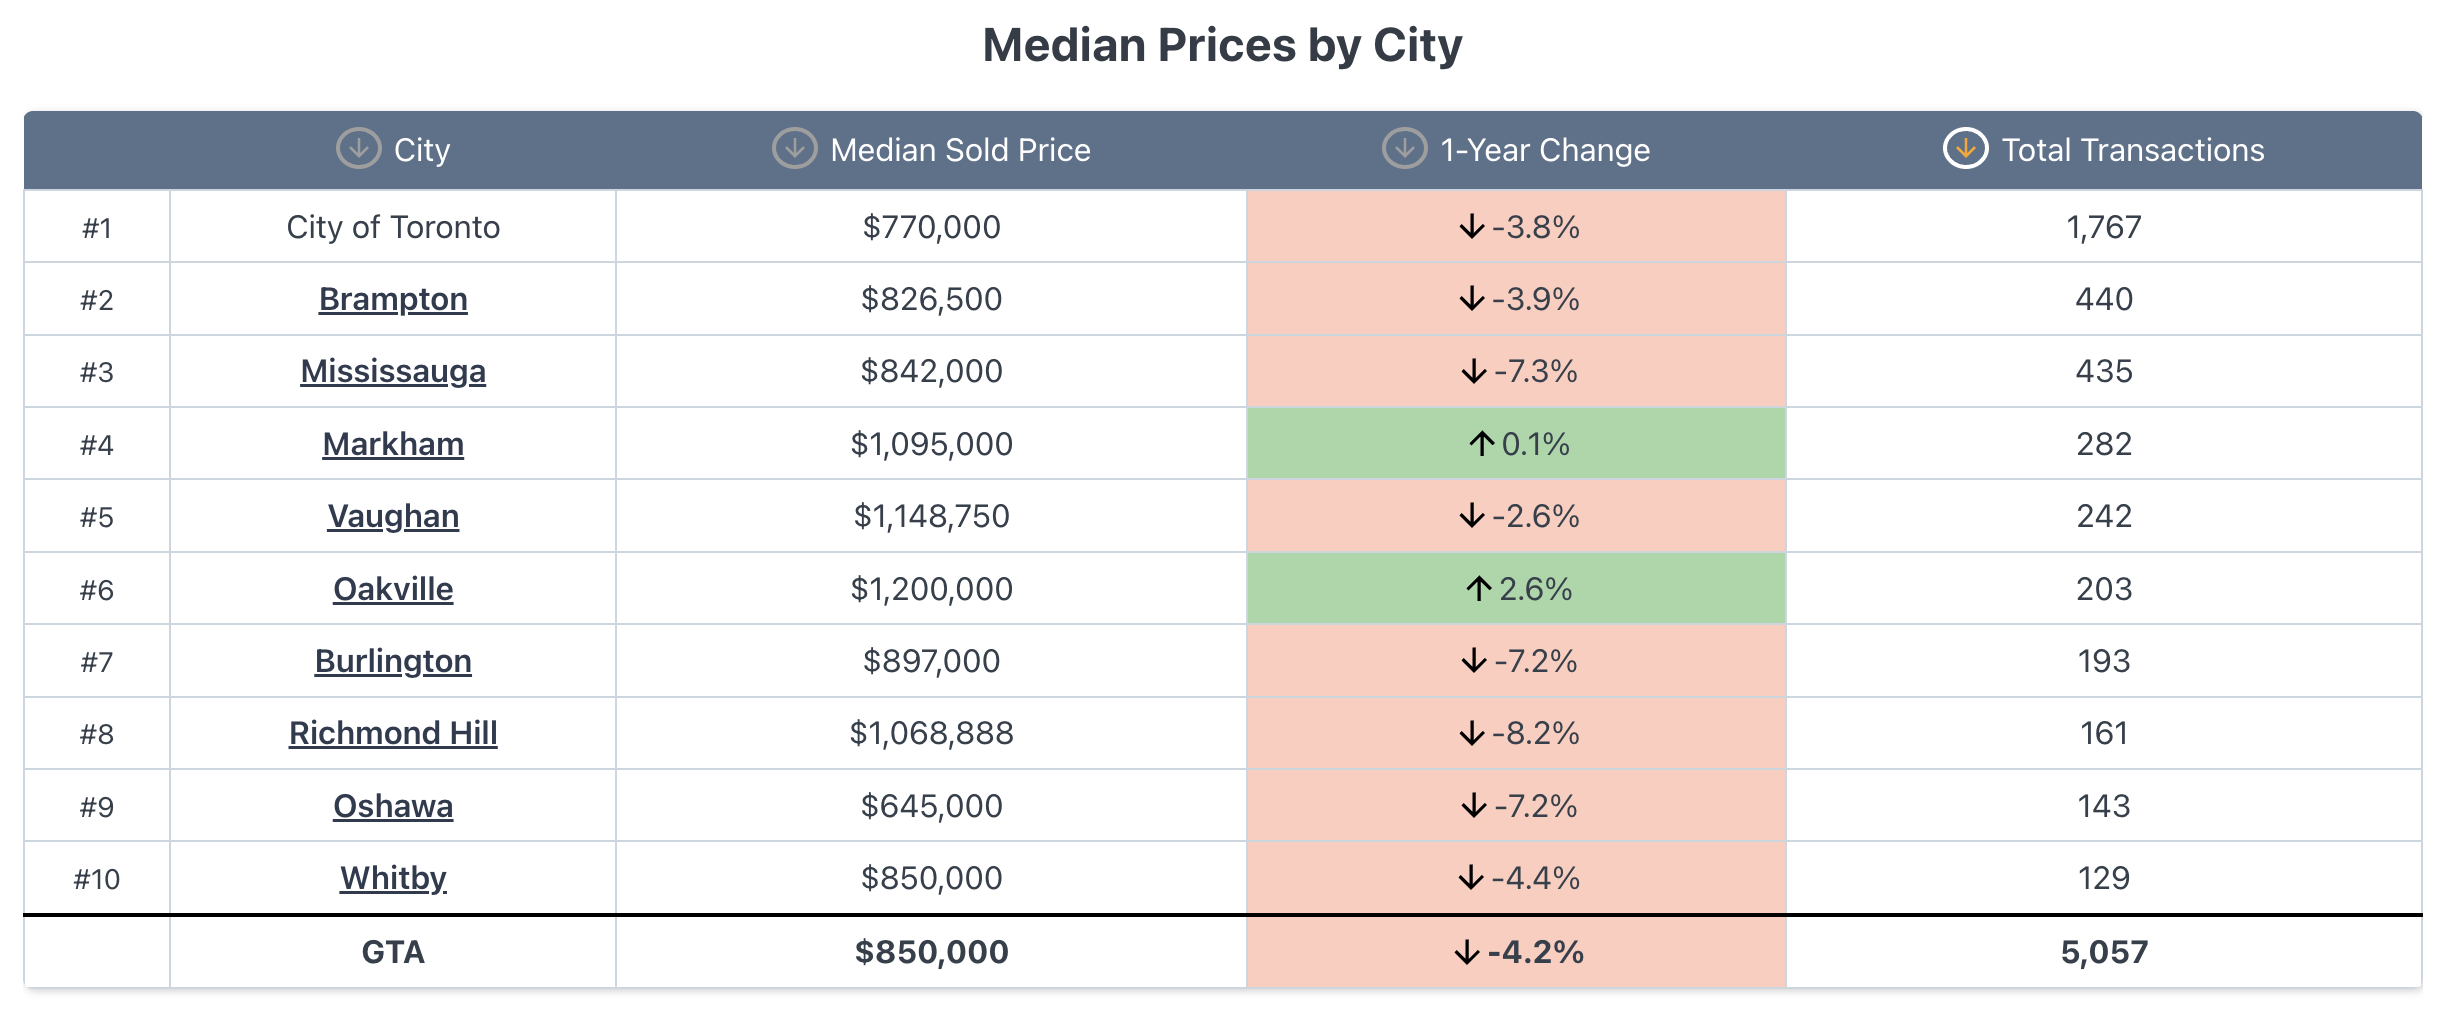
Oakville's average sold price fell 6.4% year over year, but the median sold price rose 2.6% year over year to $1,200,000. Across the GTA, Oakville and Markham (+0.1%) were the only two cities on the top-10 list to post a positive year-over-year median. Halton Region as a whole was down 6.1% year over year, with a median of $957,000.
When an average falls while the median rises this points to one stat; the luxury and ultra-luxury market are doing well. Mind you this in on month so we will want to watch this month over month. One or two big sales could have skewed this in August. This is the one to watch.
What this means for you
These are citywide numbers. Your street, your specific home, your specific price point, they can tell a completely different story than the average. If you want to know exactly how this affects your neighbourhood or your home, reach out and I'll pull the numbers for you.
Price It Right and Show It Well™
Sources: WOWA.ca (CREA/TRREB data), OMDREB MLS Home Price Index, Habistat Market Insights.
