

Here's a full breakdown of Burlington's housing market for August 2026, average and median sold prices by property type, benchmark price history, days on market, and year-over-year trends, pulled from WOWA, RAHB, TREB and Habistat.
August 2026, by property type
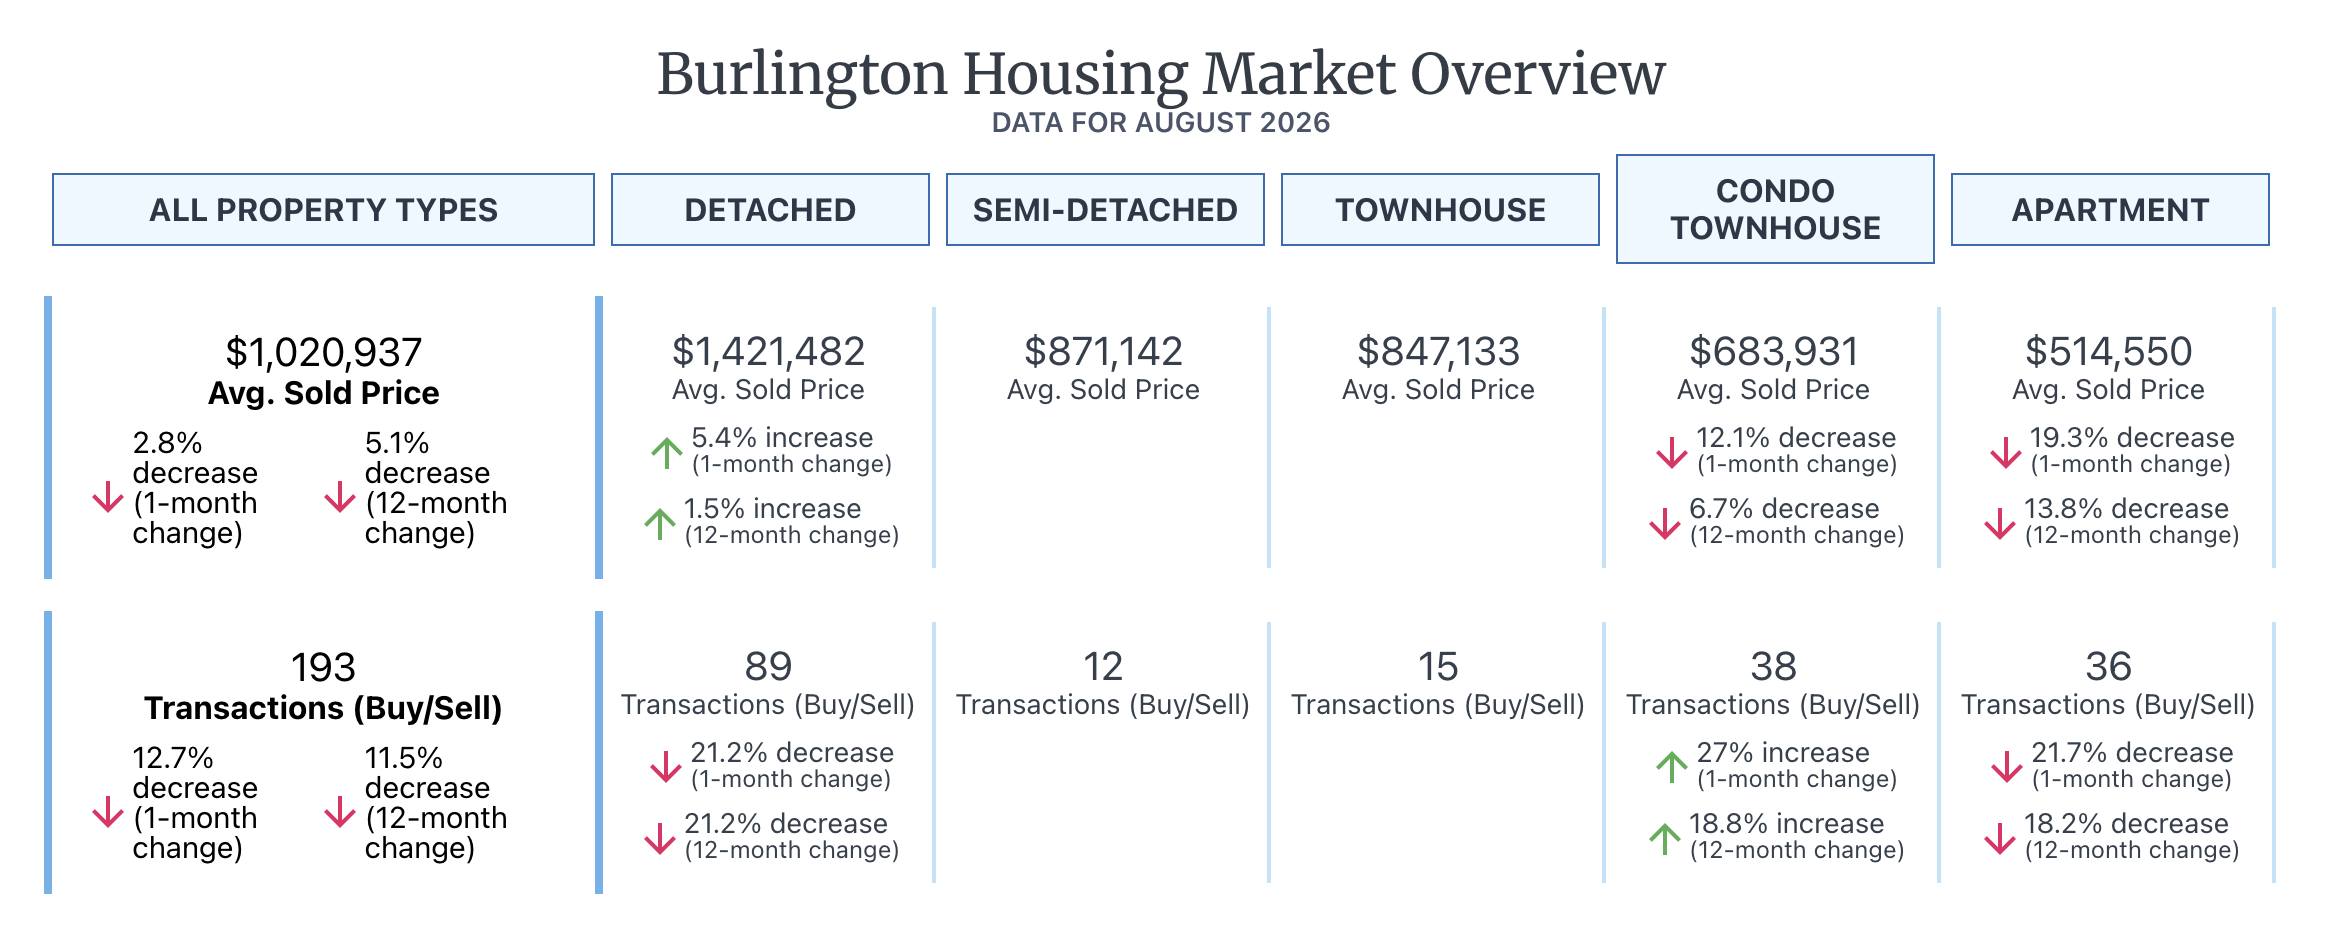
Nice little jump month over month for Detached. If you are thinking of selling an average detached and buy a condo… GET ON IT! Detached up/flat and condos down 20%.
Quick peak at my favourite charts before moving forward:
Benchmark price for Detached, Townhouses, and Condos
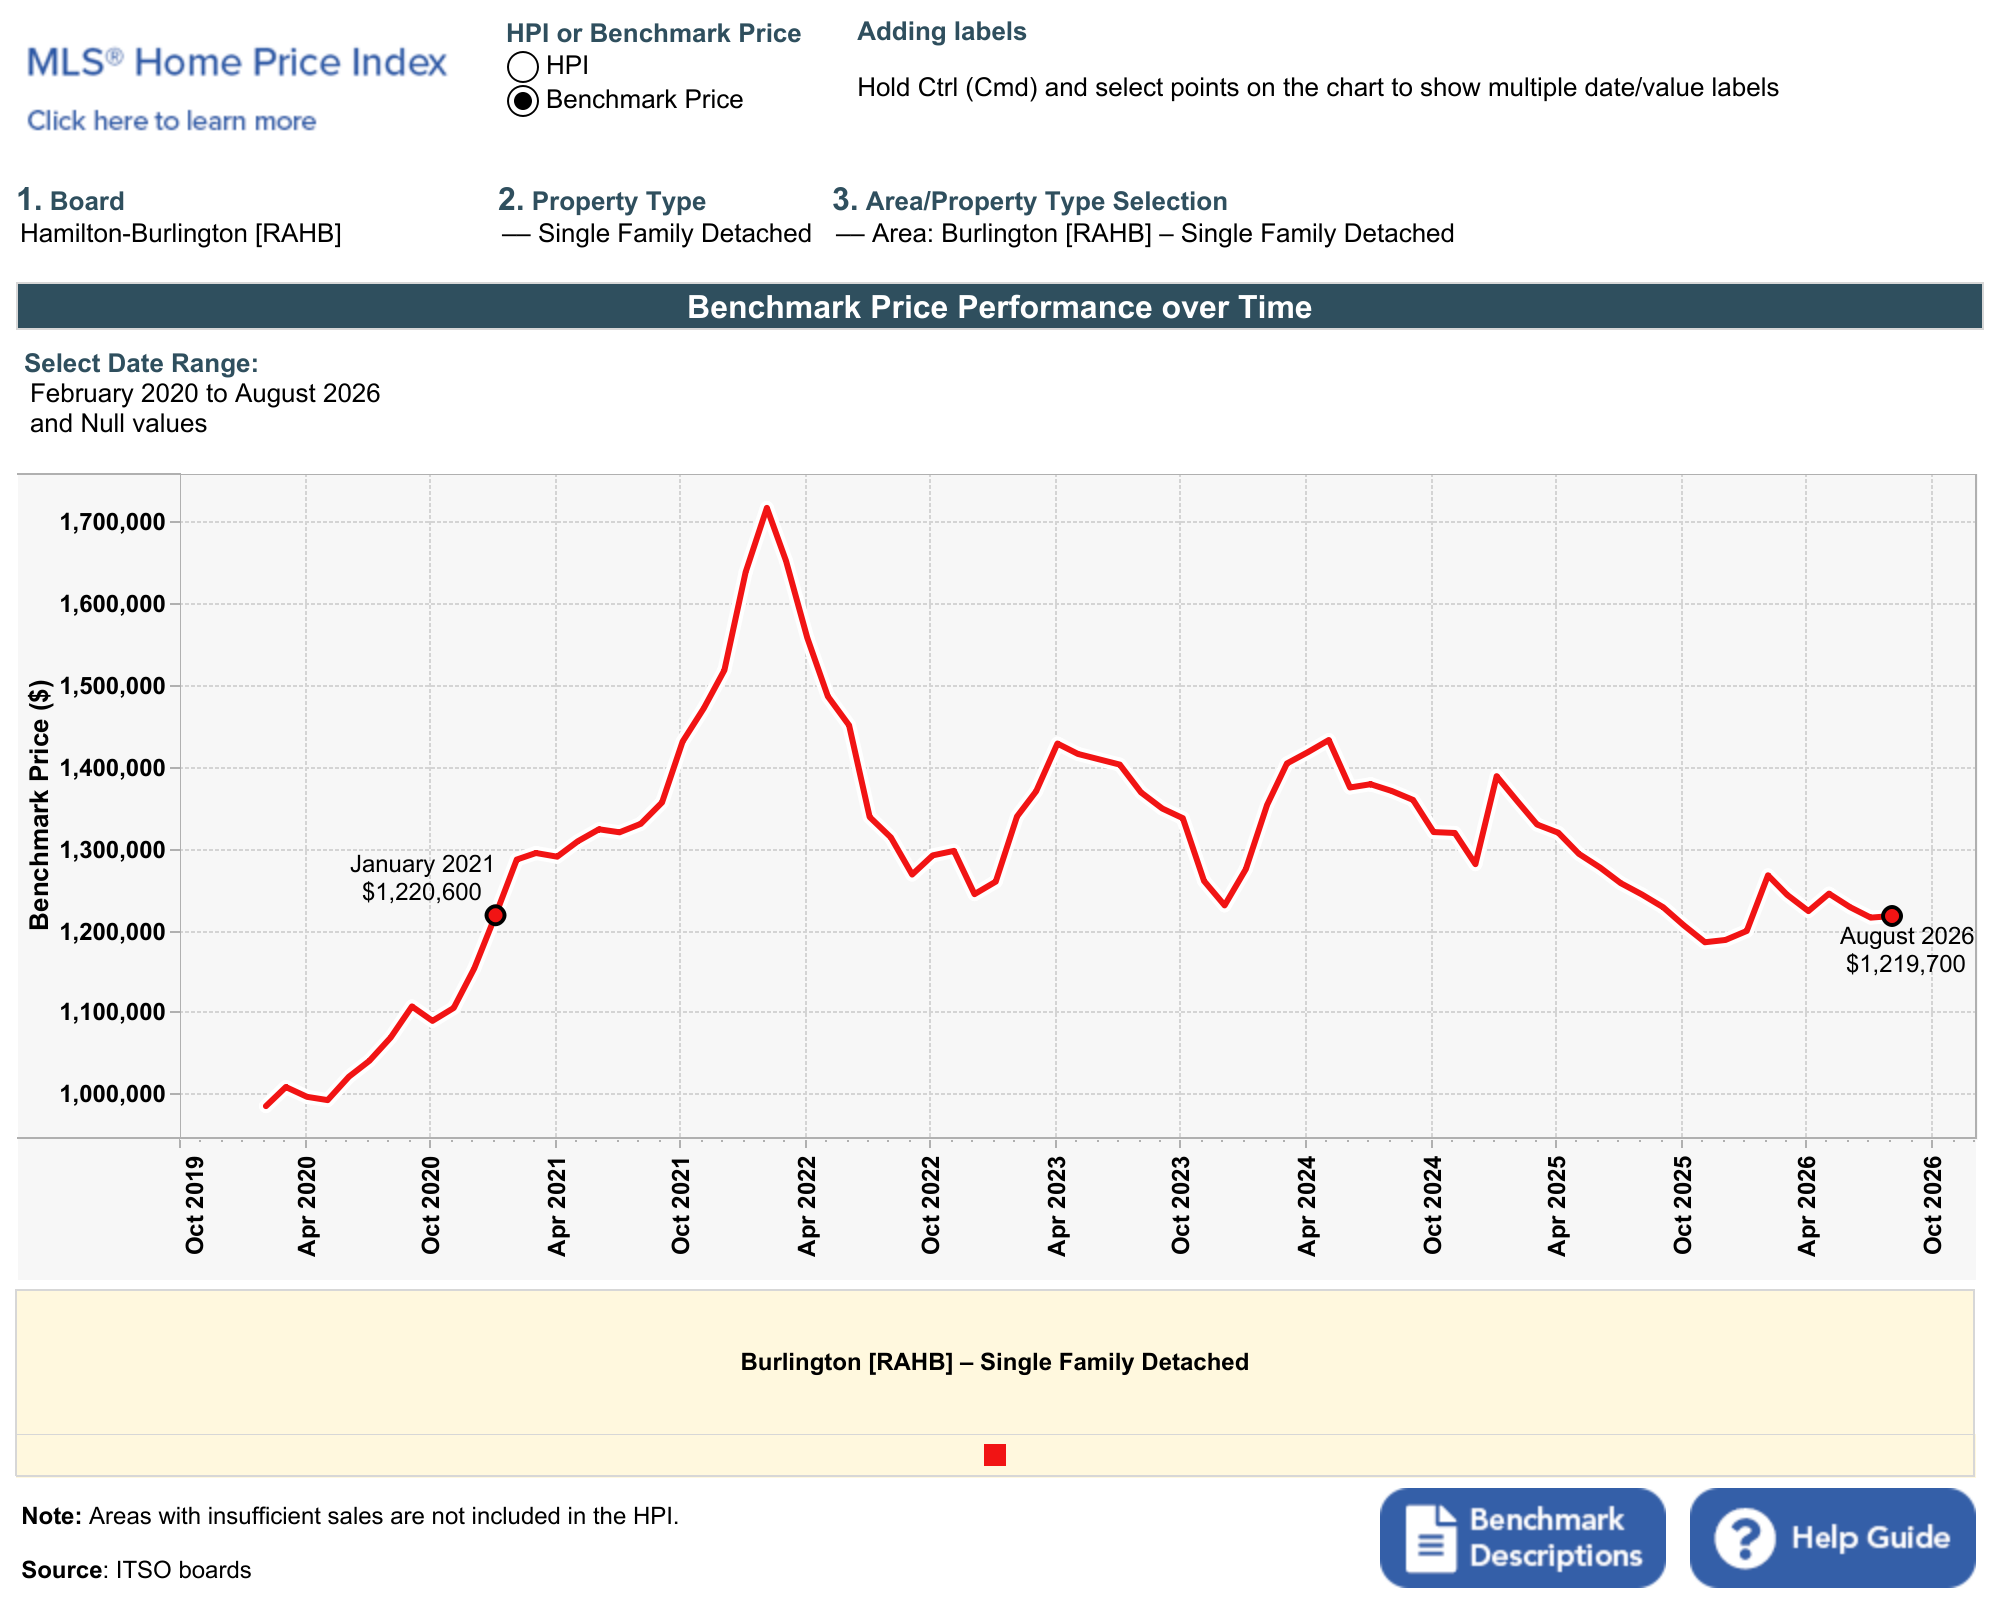
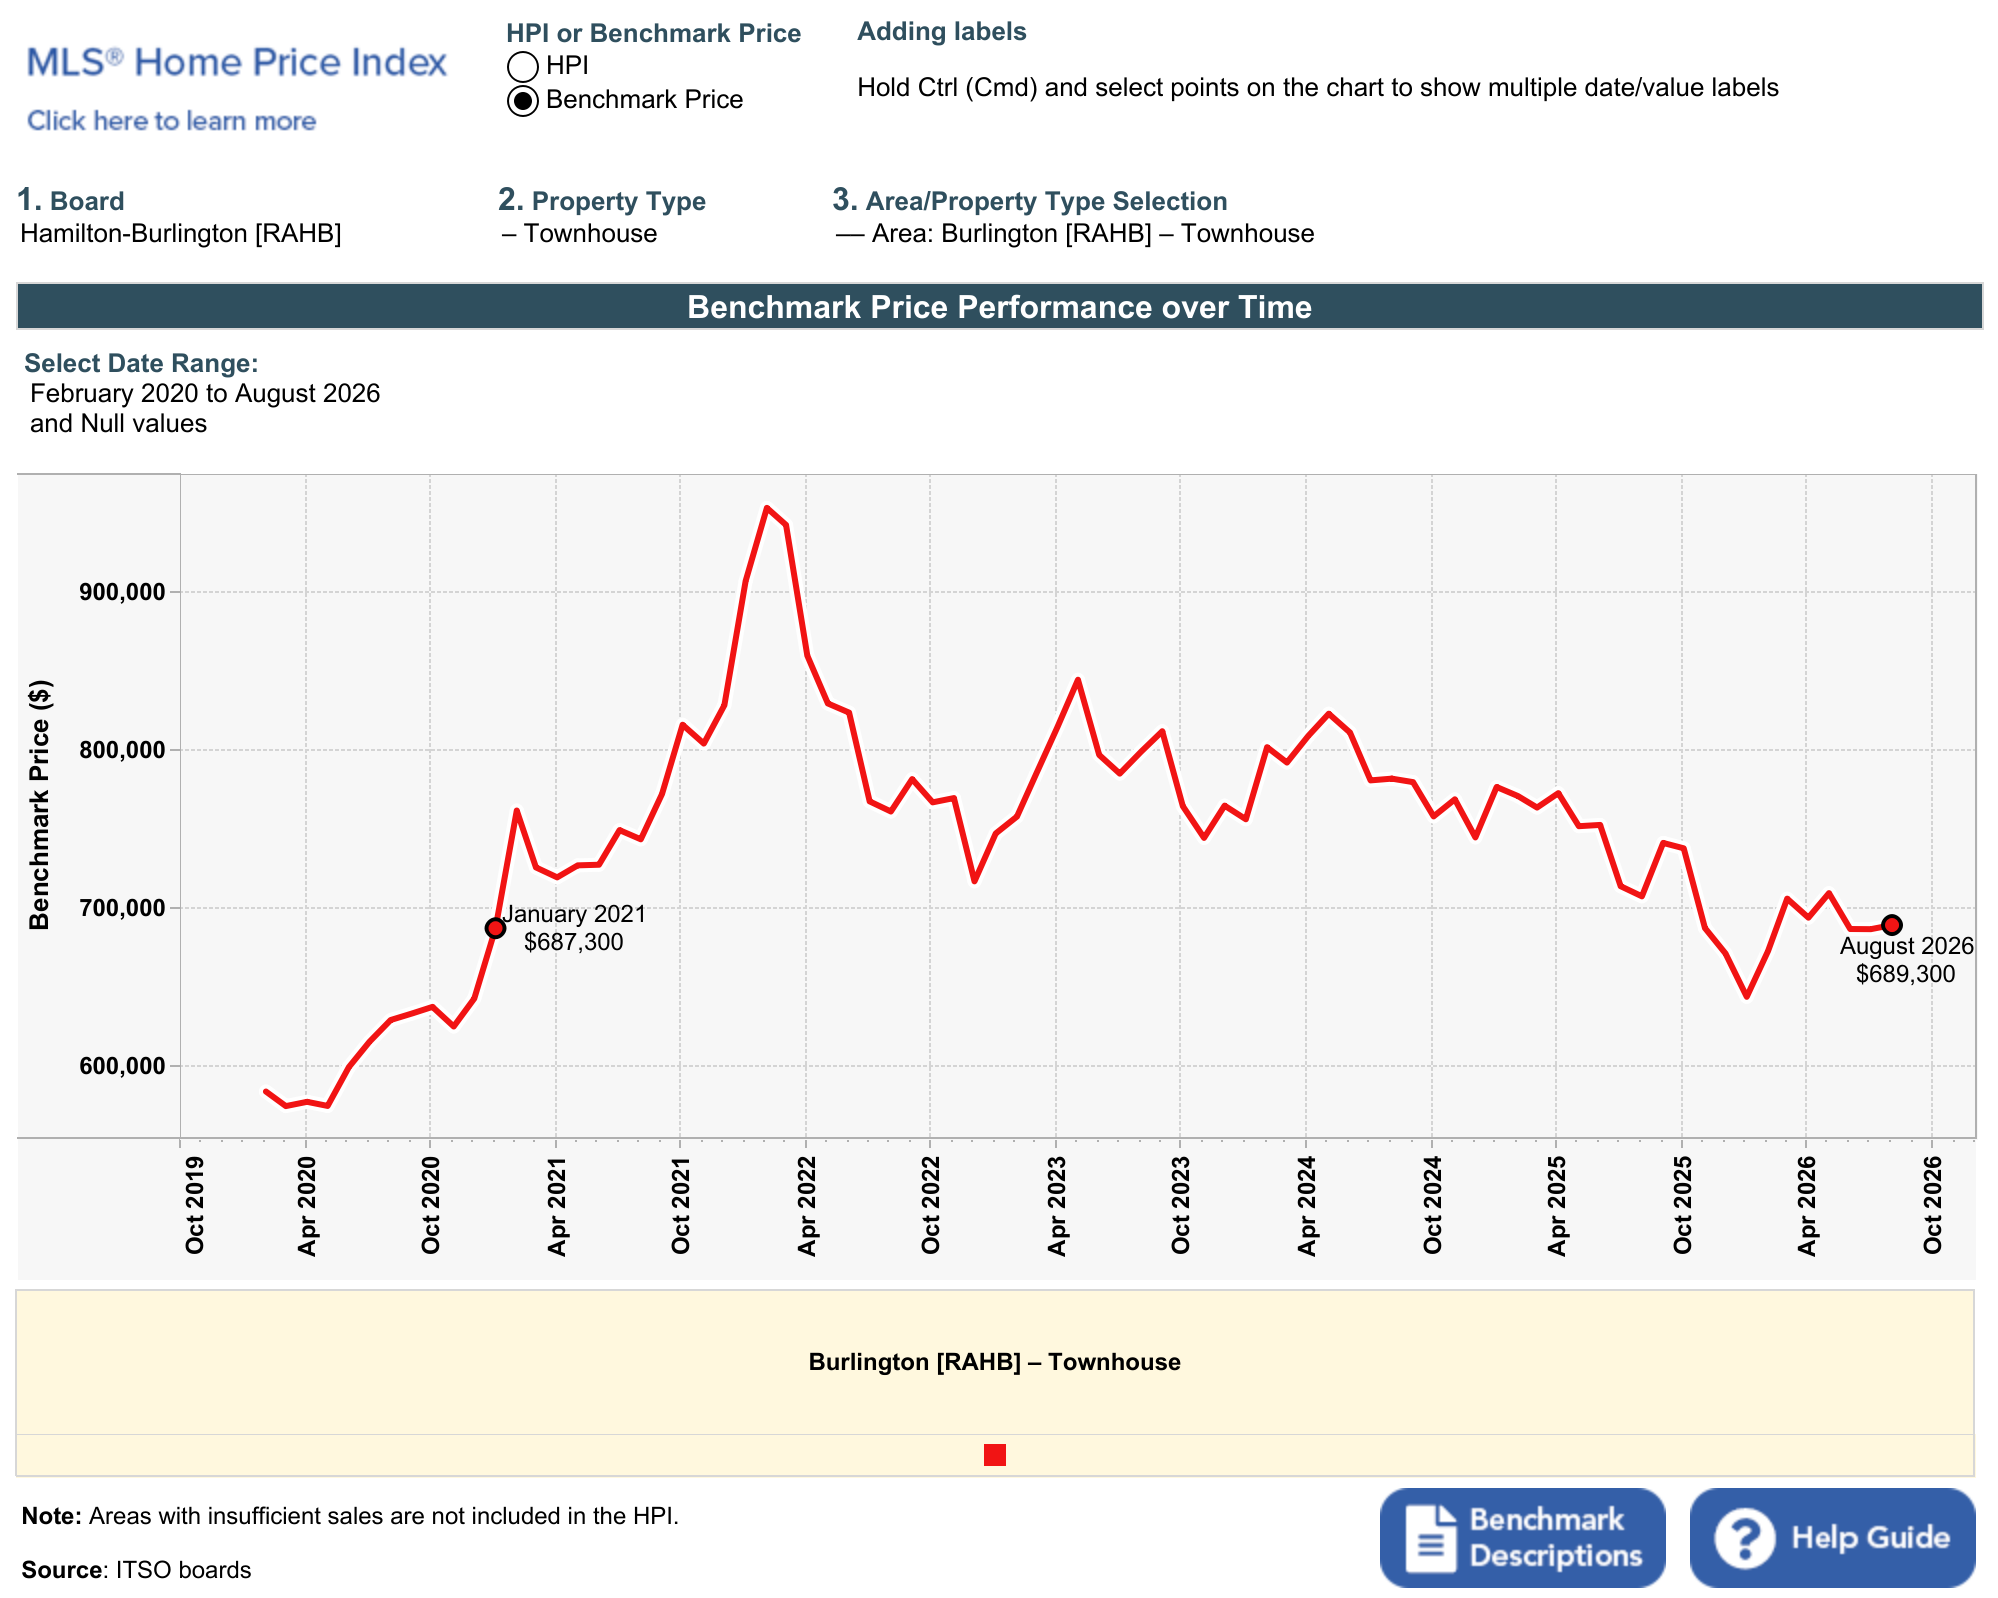
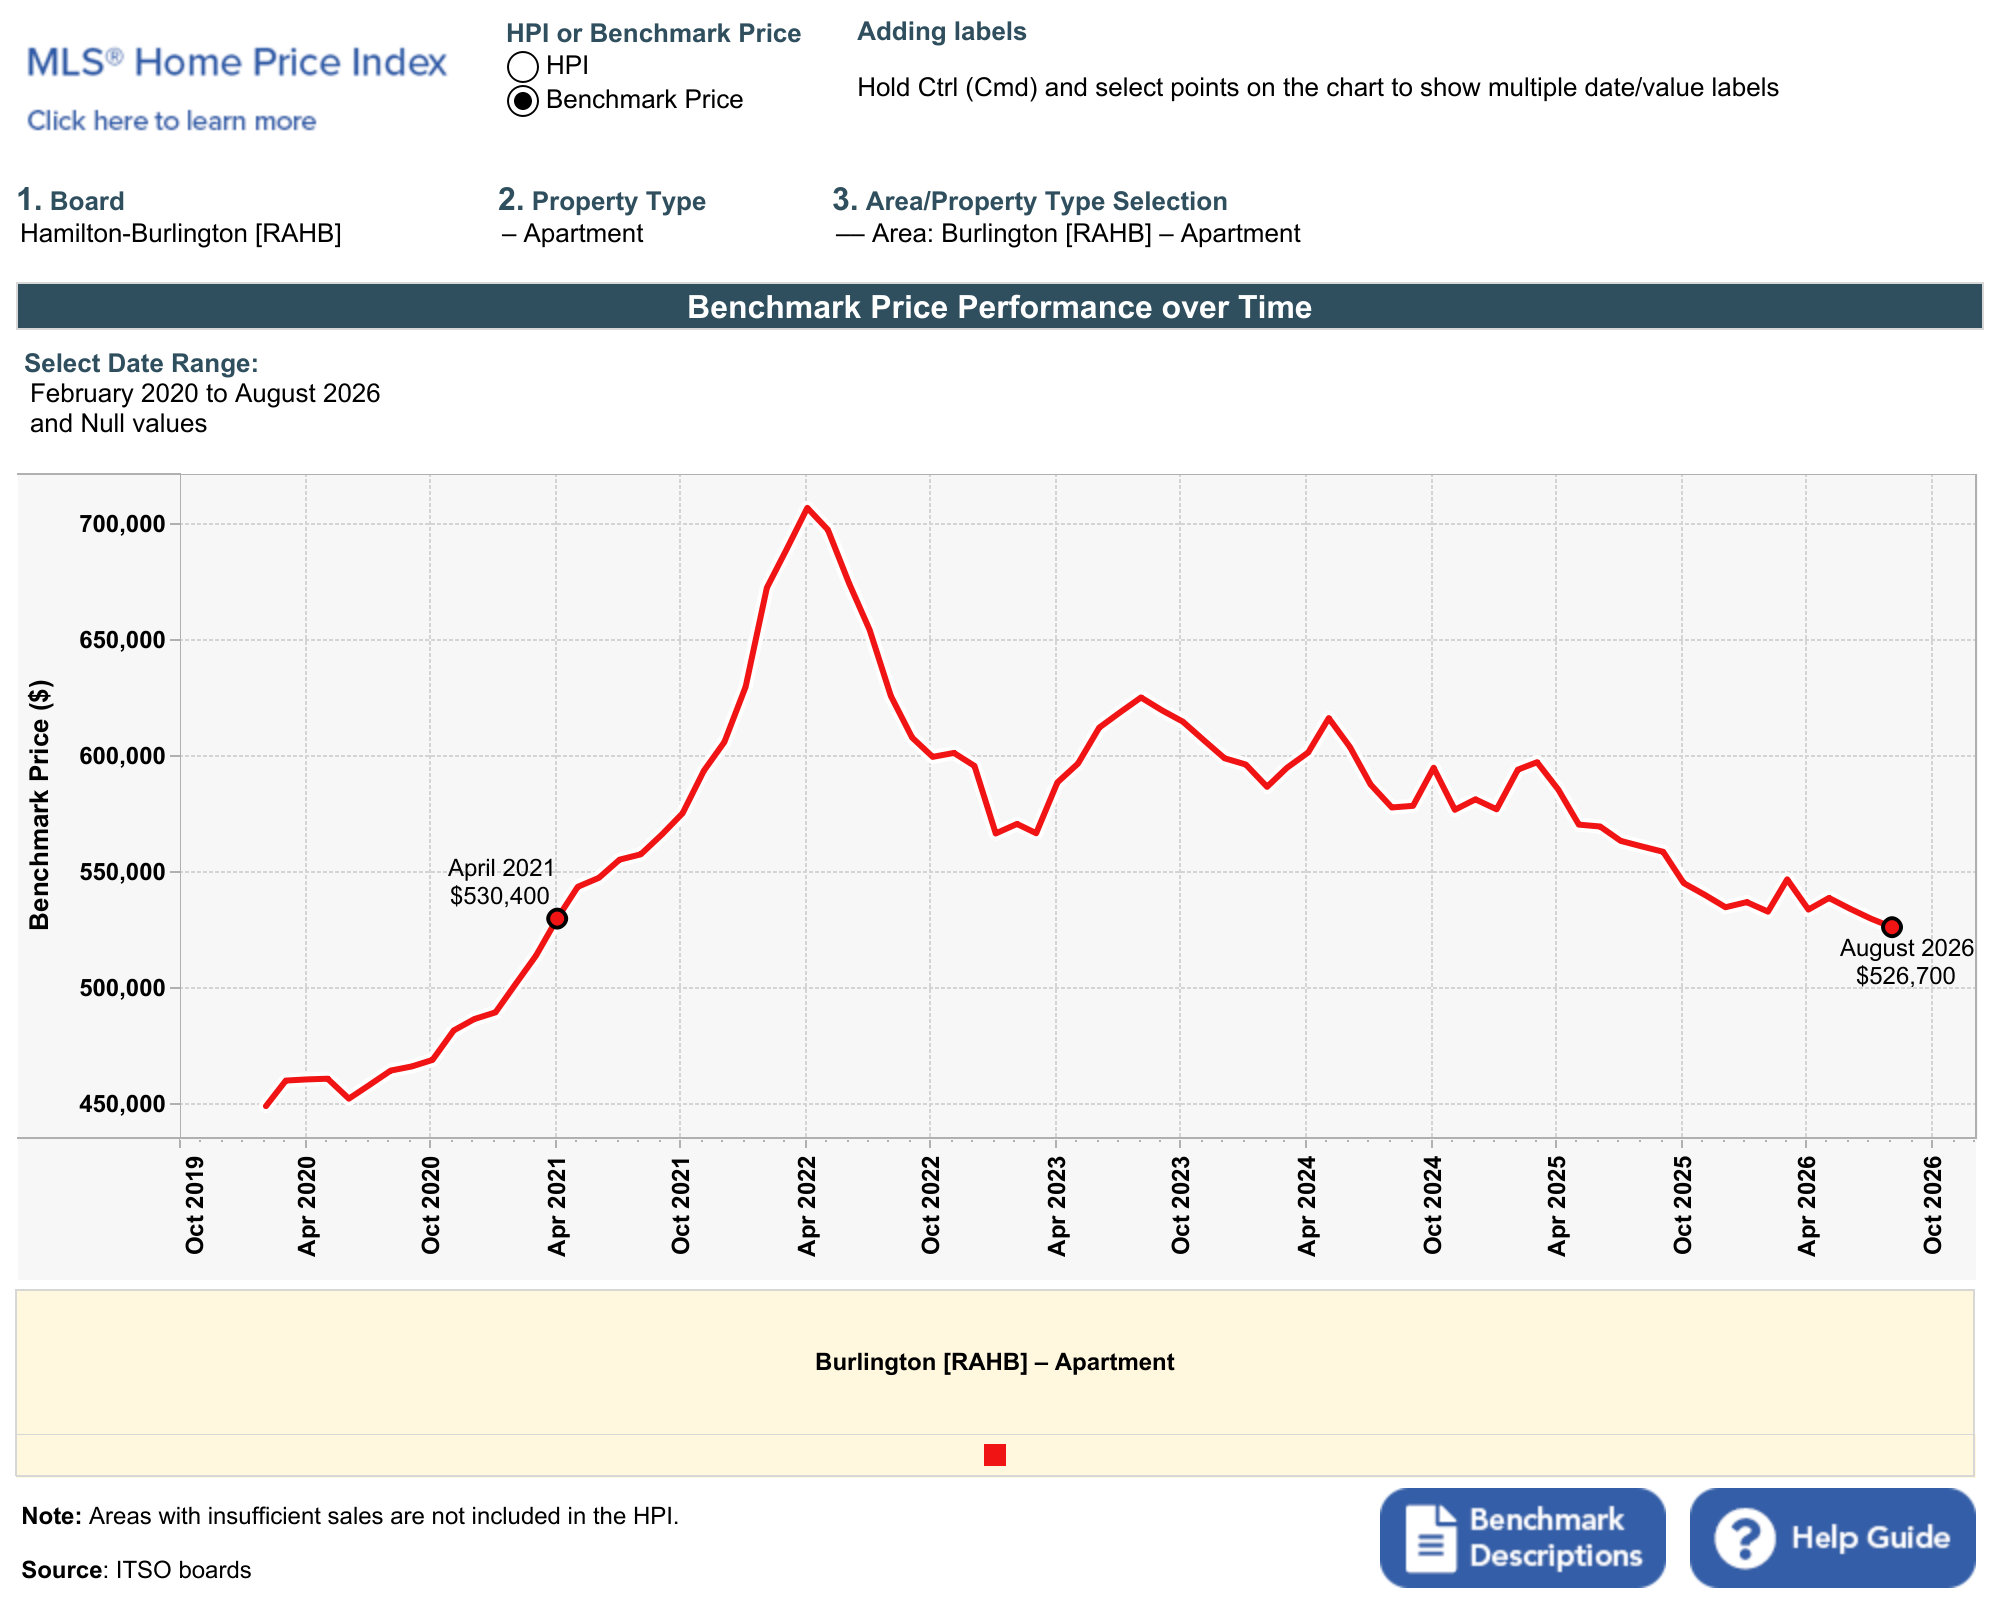
I plotted the 2021 points because I hear from so many that ‘we’re back to 2021 prices’ so I imagine you hear the same. Different market then but it is great to see this trend over time.
Detached is the strong spot right now
Detached homes were up 5.5% from July and up 1.5% from a year ago. August detached sales averaged $1,416,488, with a median of $1,255,000 on 92 sales. Nearly 1 in 5 detached sales (19.6%) went above asking, and homes sold for 97% of their list price on average, sitting on the market for about a month.
That's a market with real momentum heading into fall.
Condos and apartments are the soft spot
Condo townhouses dropped 12% from July and are down 7% from last year. Apartments dropped 14% in a single month. That's the steepest slide in the whole market right now.
Citywide Stats for All
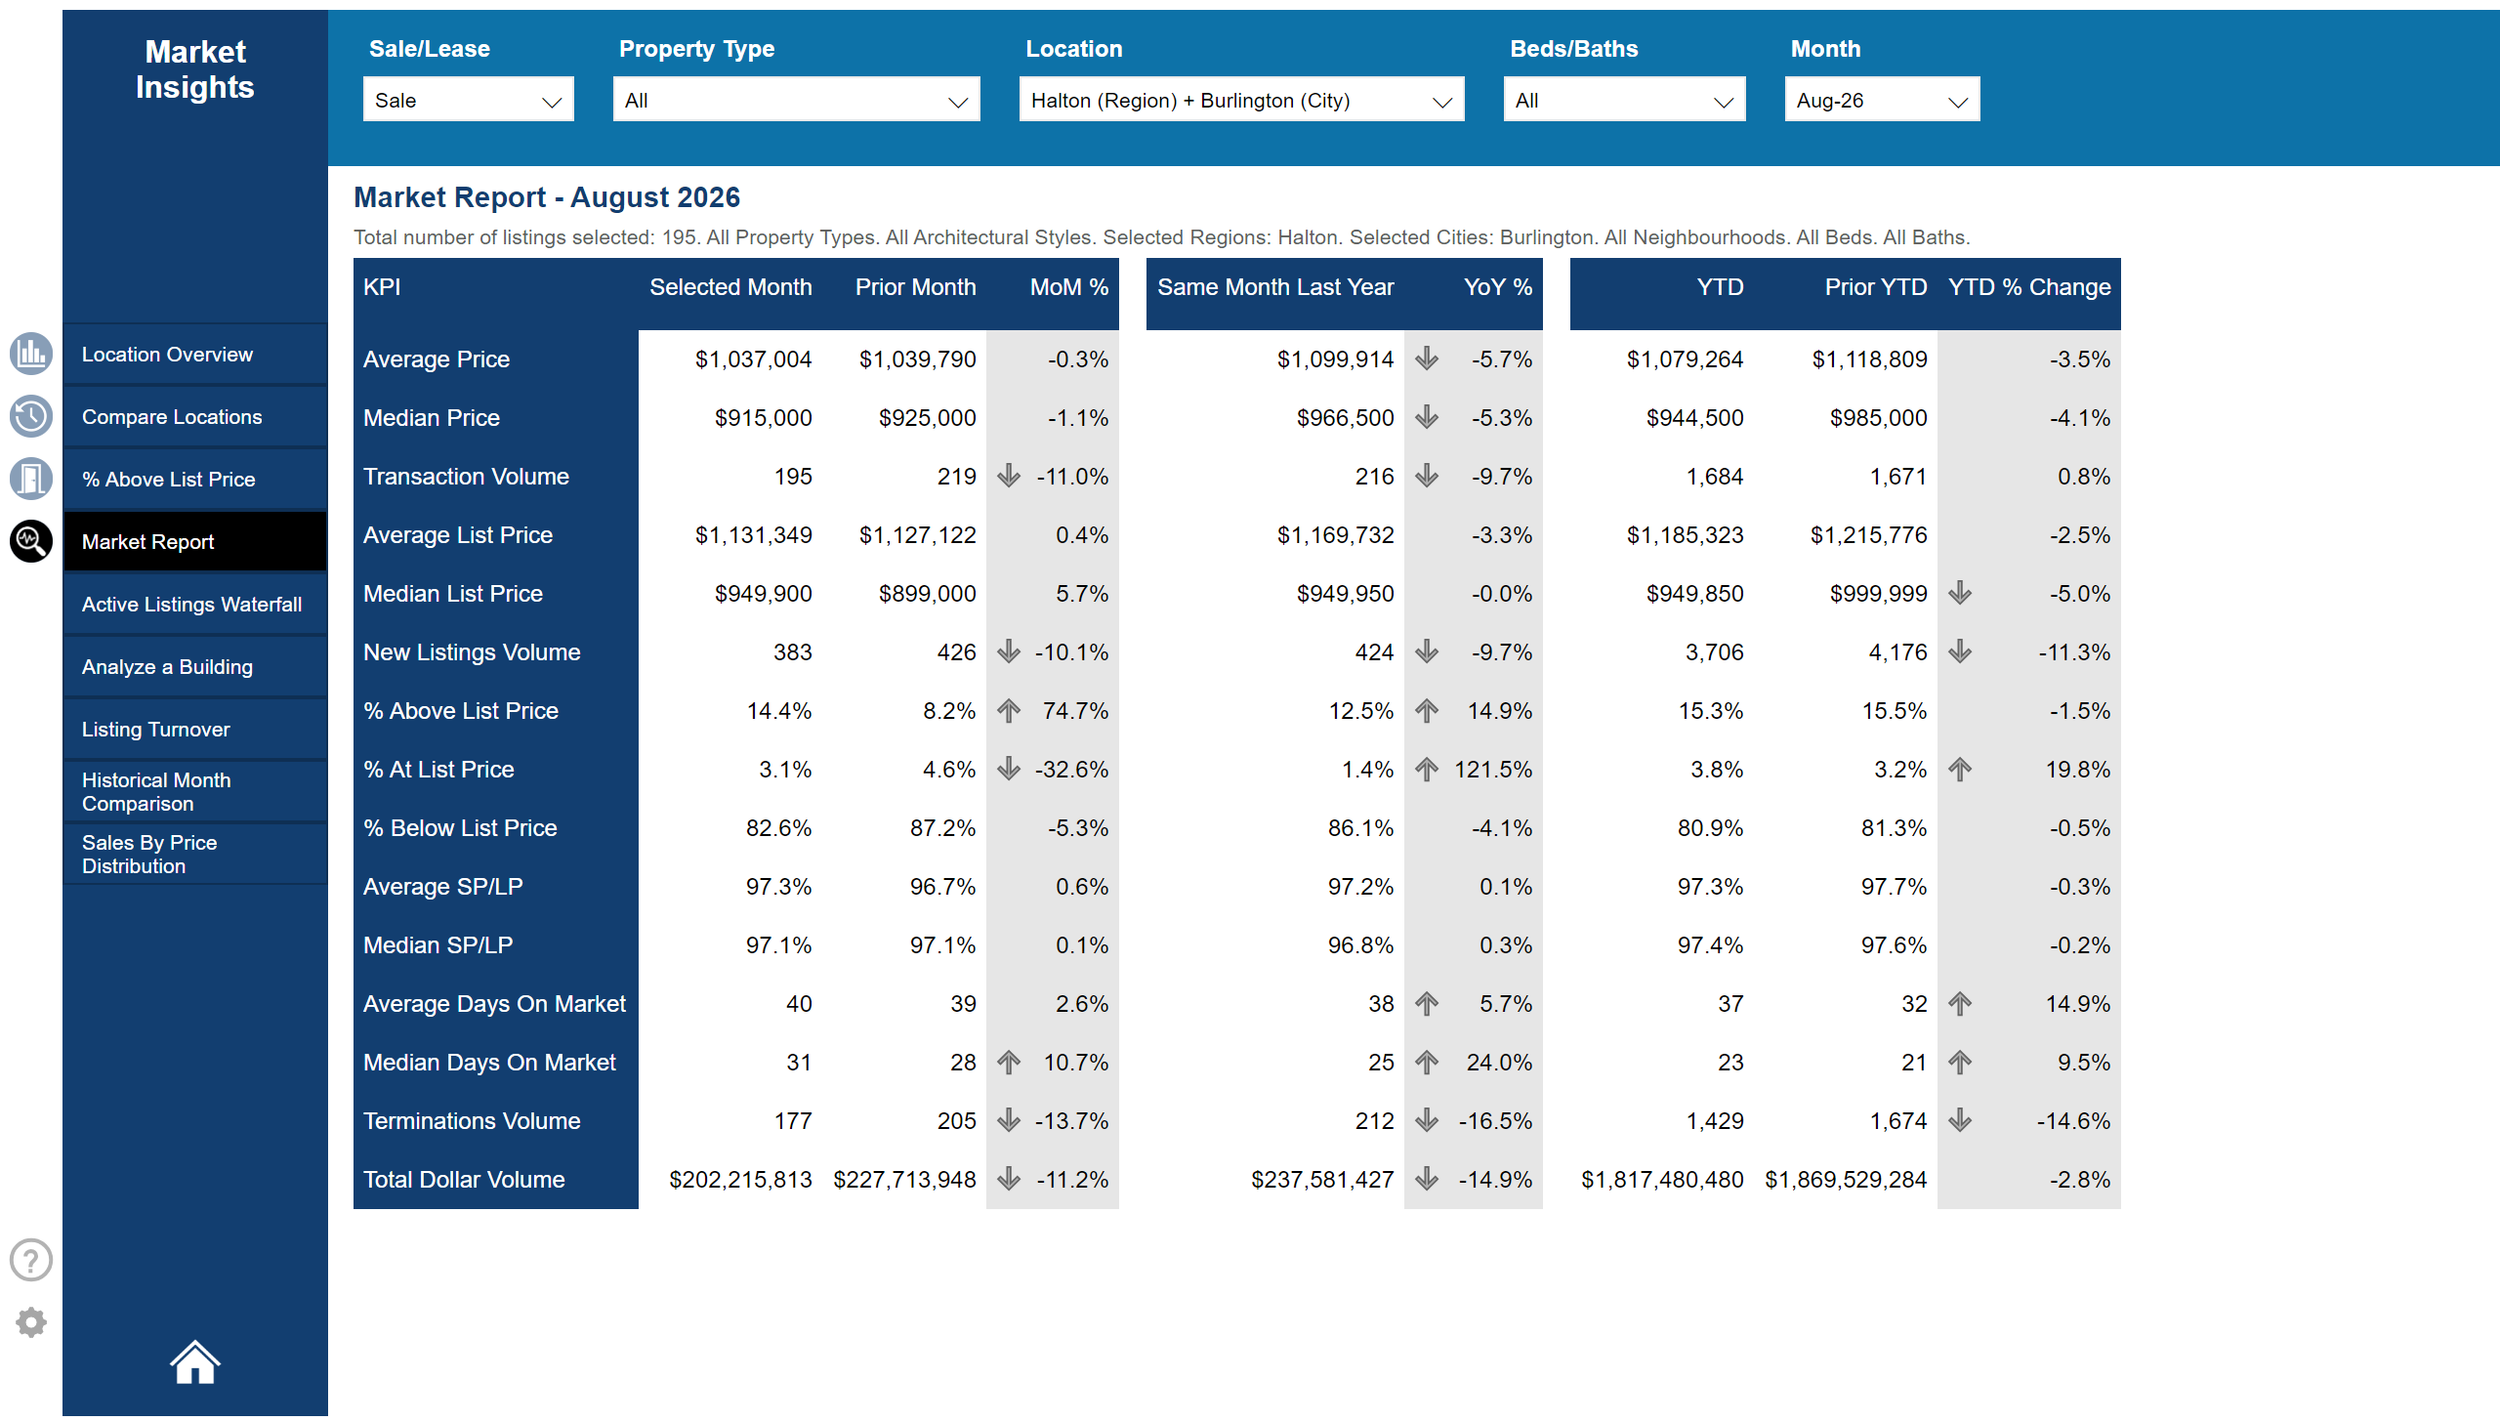
One number worth watching: 14.4% of all sales went above asking in August, up noticeably from July's 8.2%. That's a real jump, though it's still close to the year-to-date average. Meanwhile, 83% of homes still sold below asking. Homes took a bit longer to sell too, averaging 40 days on market, up from 39 in July.
Detached is basically back to 2021 prices. Condos are too, but the road there was different.
The benchmark price for a detached home in Burlington was $1,220,600 in January 2021. Today it's $1,219,700. Almost identical. In between, it spiked past $1.7 million in 2022 before pulling back down.
Condo apartments show a similar "back to 2021" number, $530,400 then, $526,700 now, but they didn't spike and recover the way detached did. They've been on a slow, steady slide since 2023. Townhouses land in the middle: $687,300 in January 2021, $689,300 now. Condo townhouses really drag down Freehold townhouses.
Also, check out the sweet spot:
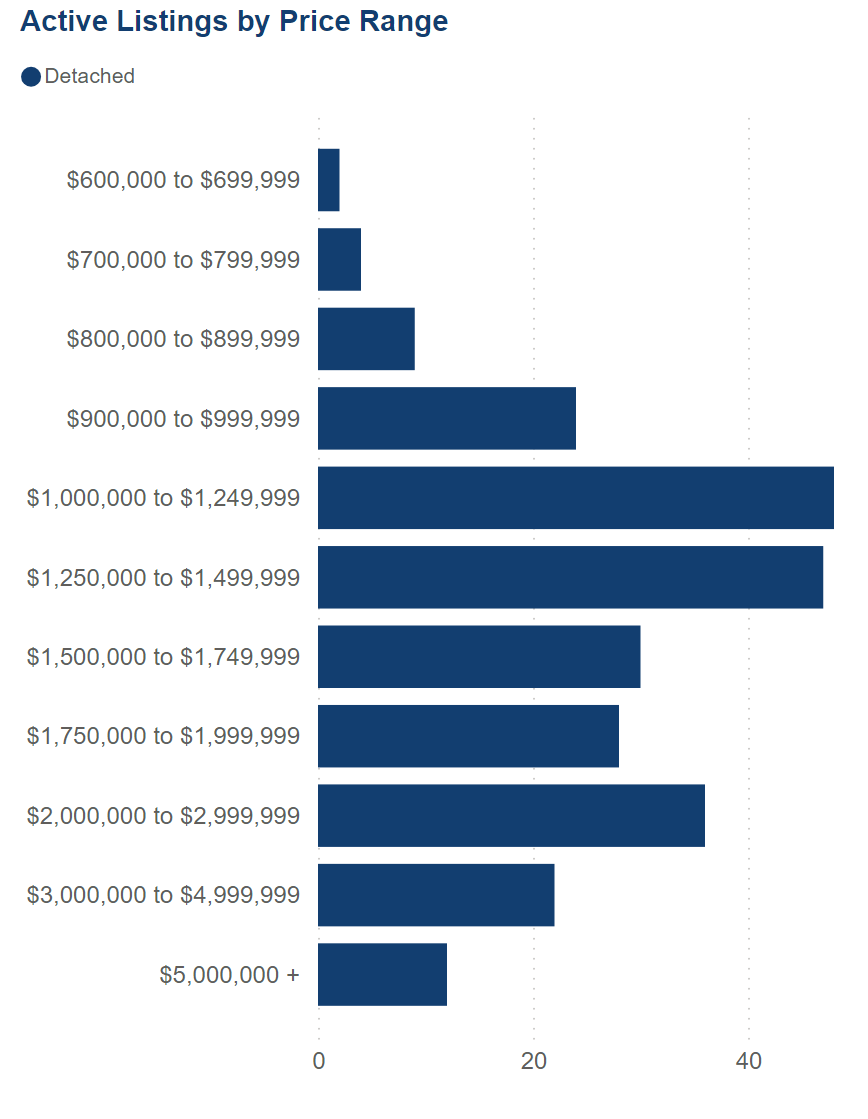
$1 Million to $1.5 Million still rule Burlington. $2 - $3 Million in second.
Fun Fact
Zoom out further and the picture is simple: Burlington's median home price is up 38.7% over the last ten years.
Fewer bidding wars every year
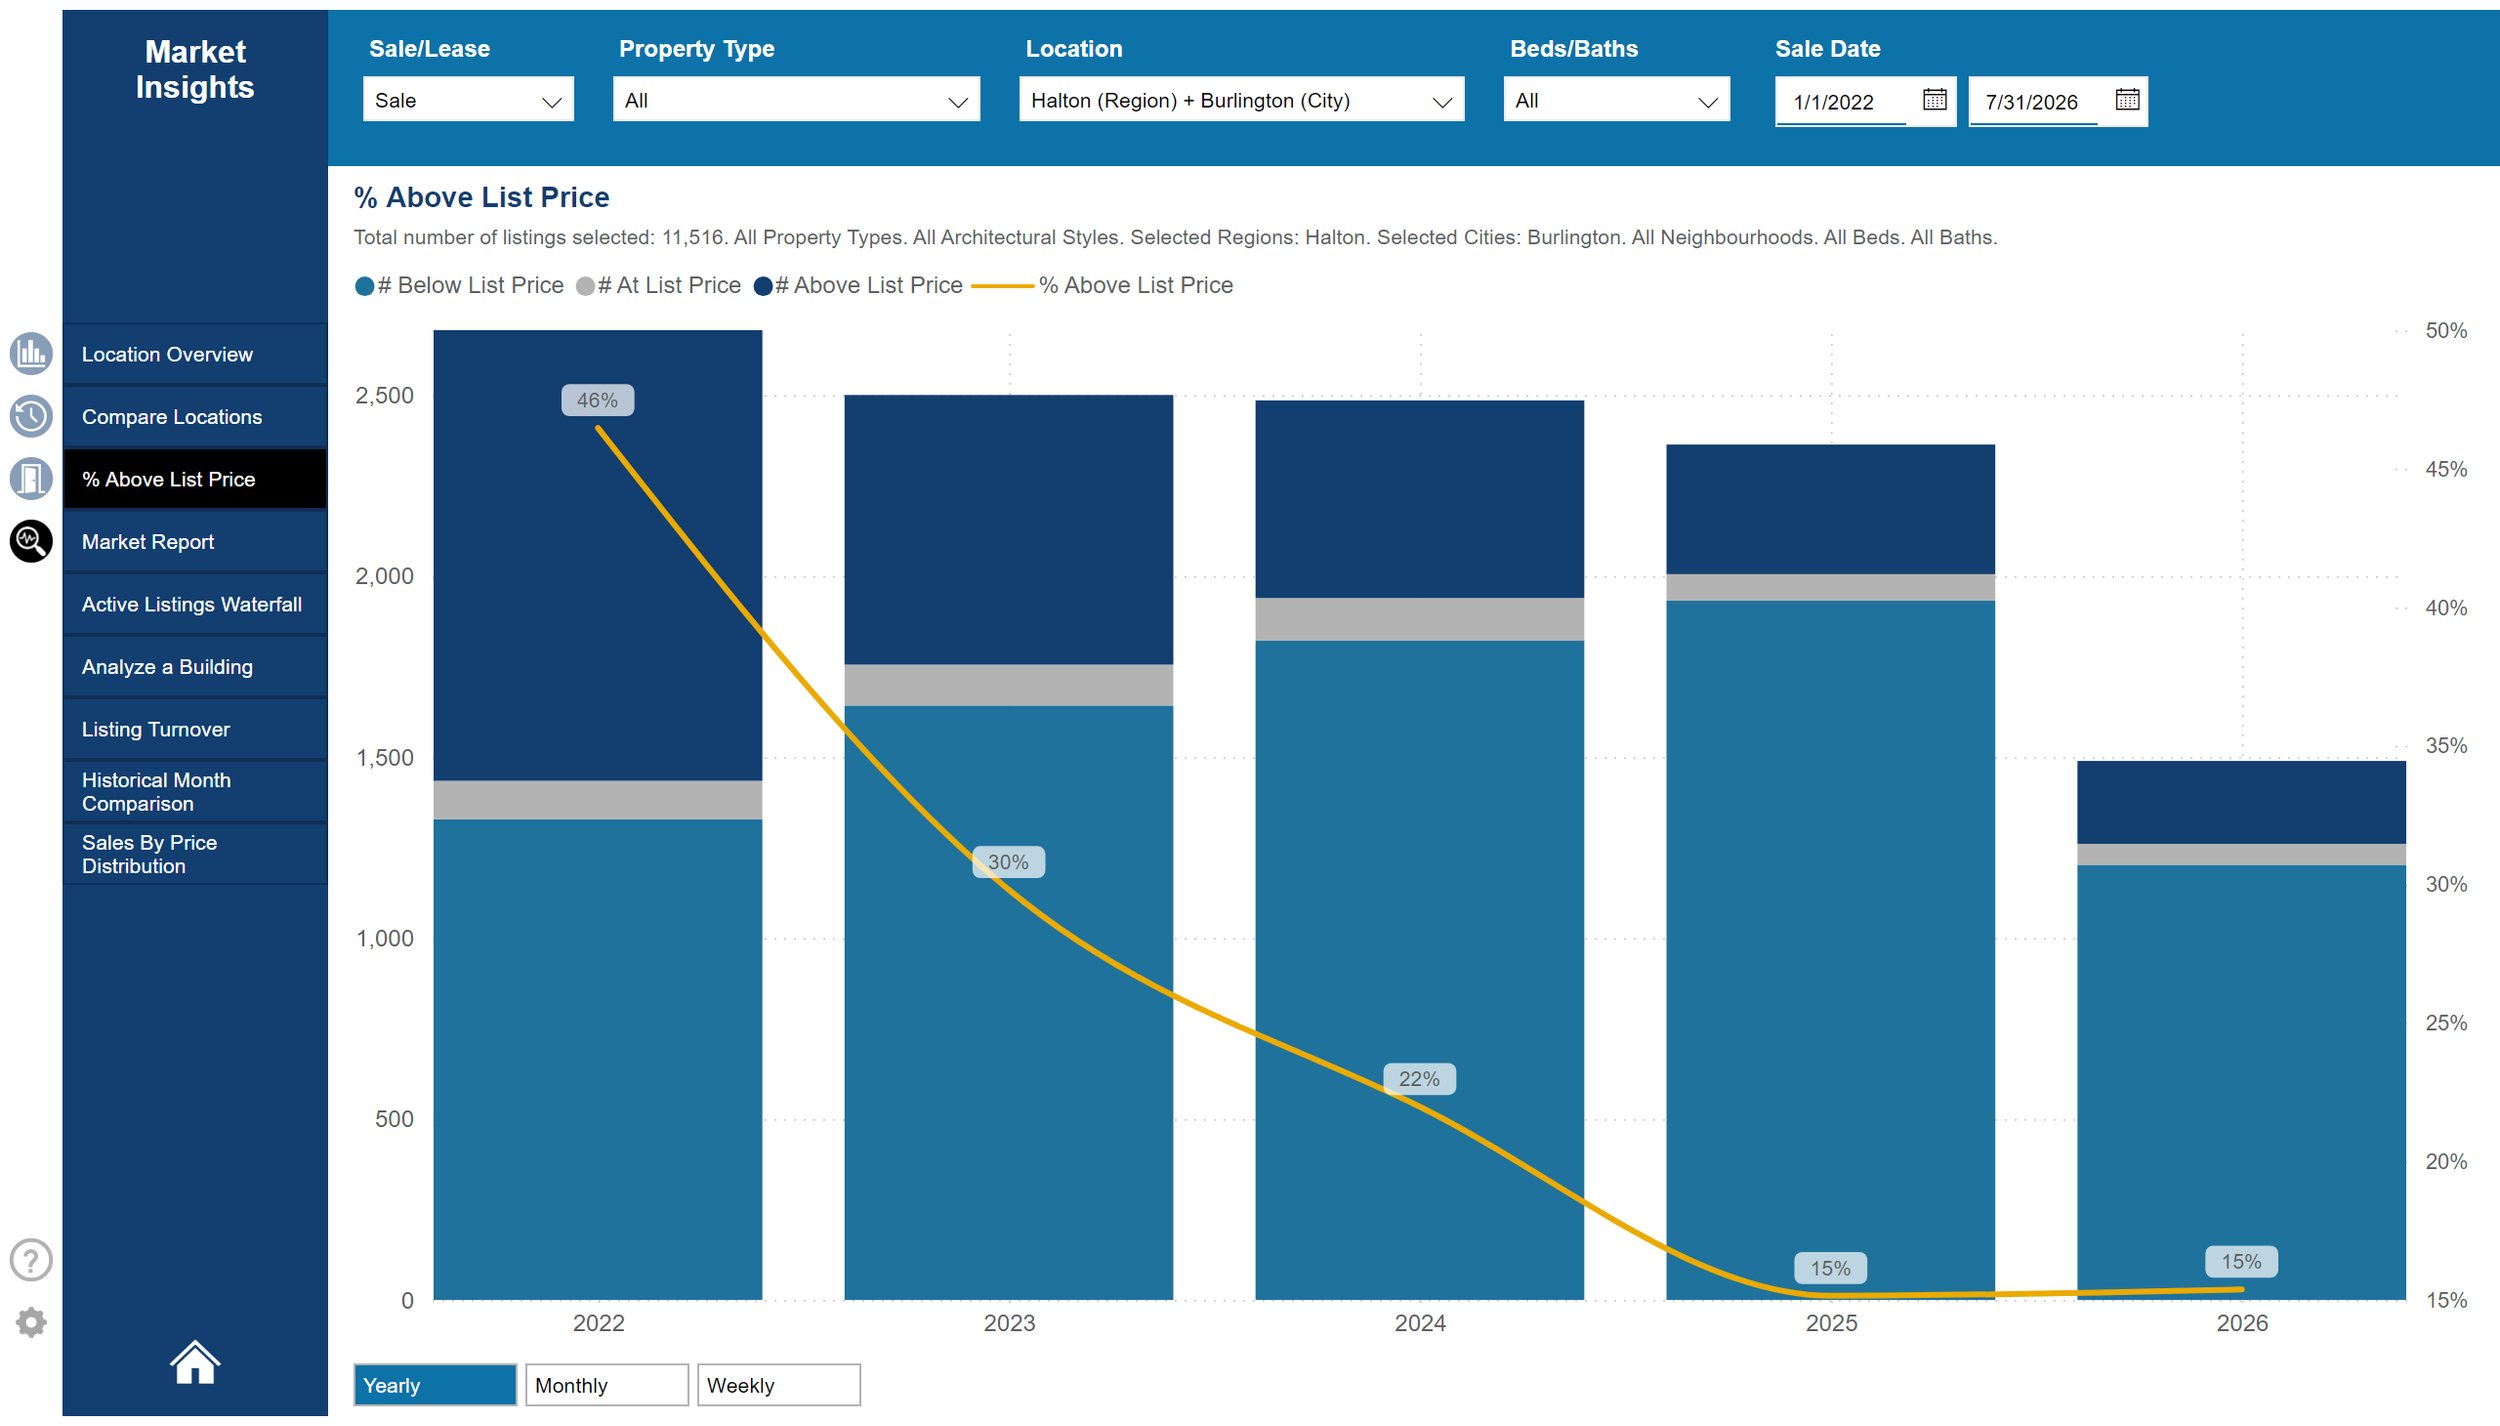
The share of Burlington homes selling above asking has been dropping steadily:
Come on, who else give you stats like this??
Bidding wars aren't gone, but they're a lot rarer than they were even two years ago. This one is interesting to me. I’ve had about 7 deals in competition this year. My pricing strategy and selling system are a nod to that. We do see many houses that do end up in competition, says 3-4 offers, still selling very close to the listing price. Even slightly below.
Where the buyers are shopping
Right now there are 262 active detached listings in Burlington, averaging $2,066,660 and sitting on the market for 49 days on average. The busiest price range by far is $1 million to $1.5 million, with a second cluster of activity in the $2 million to $3 million range.
What this means for you
These are citywide numbers. Your street, your specific home, your specific price point, they can tell a completely different story than the average. If you want to know exactly how this affects your neighbourhood or your home, reach out and I'll pull the numbers for you.
Price It Right and Show It Well™
Sources: WOWA.ca (CREA/TRREB data), RAHB MLS Home Price Index, Habistat Market Insights.
