

GTA and Hamilton-Burlington Housing Market Report: July 2026
This report covers residential real estate activity across the Greater Toronto Area and the Hamilton-Burlington region for July 2026, based on data reported by the Toronto Regional Real Estate Board (TRREB) and the Realtors Association of Hamilton-Burlington (RAHB), compiled by CREA and WOWA.
GTA Price Data
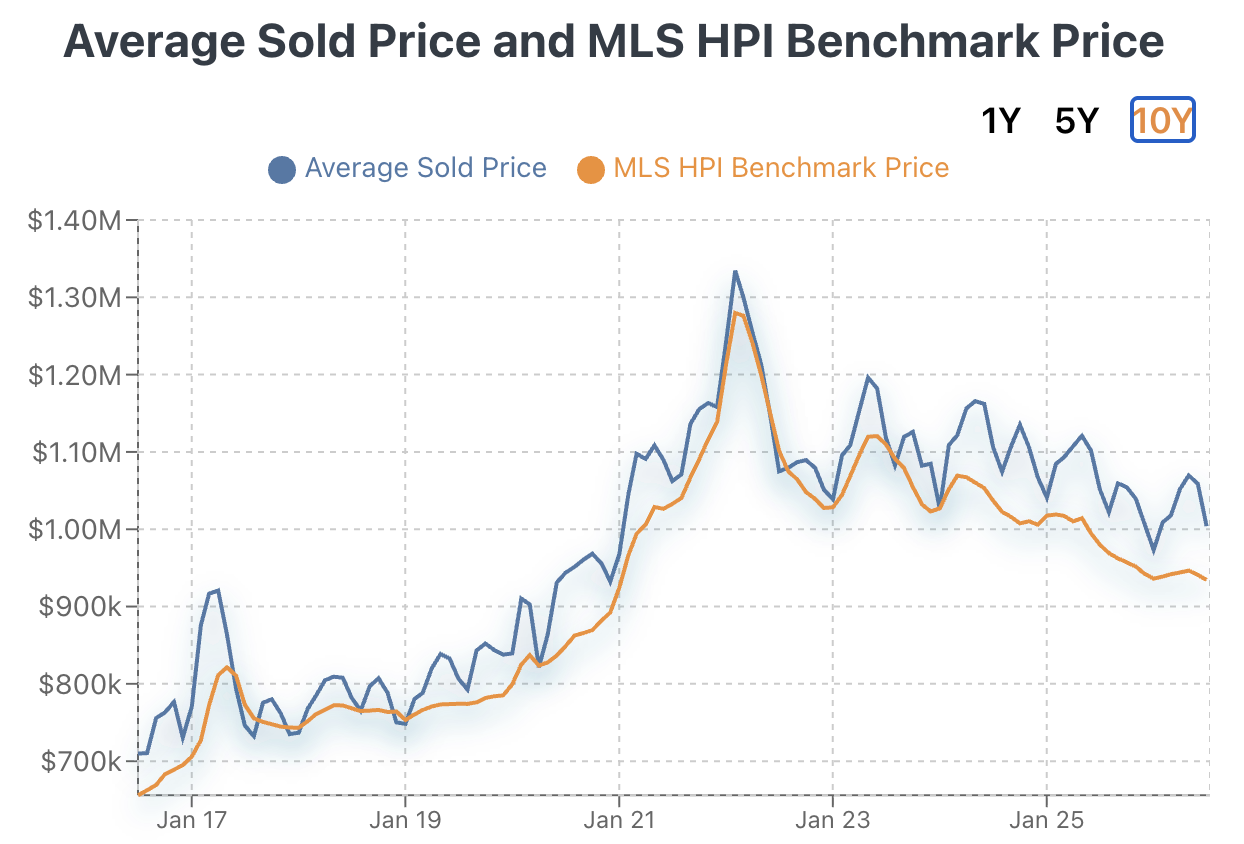
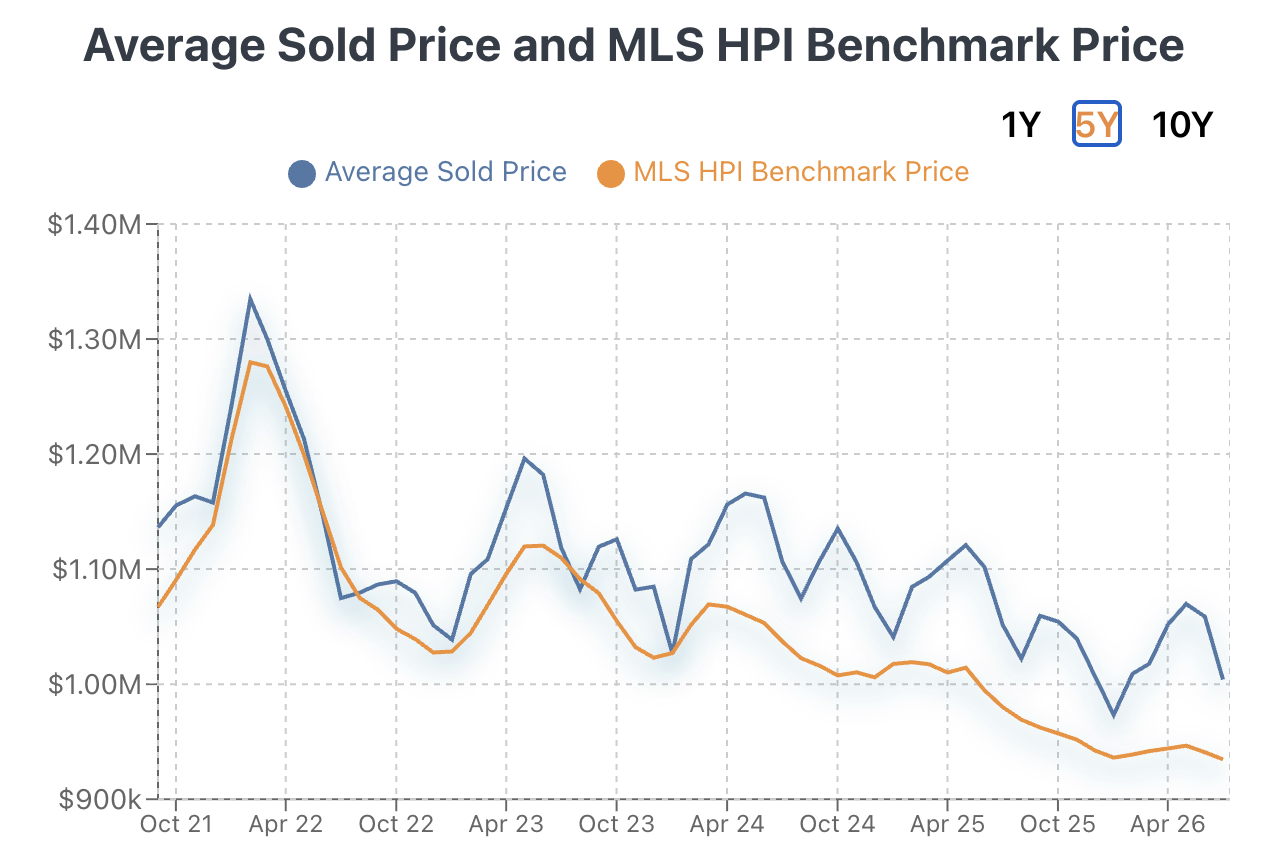
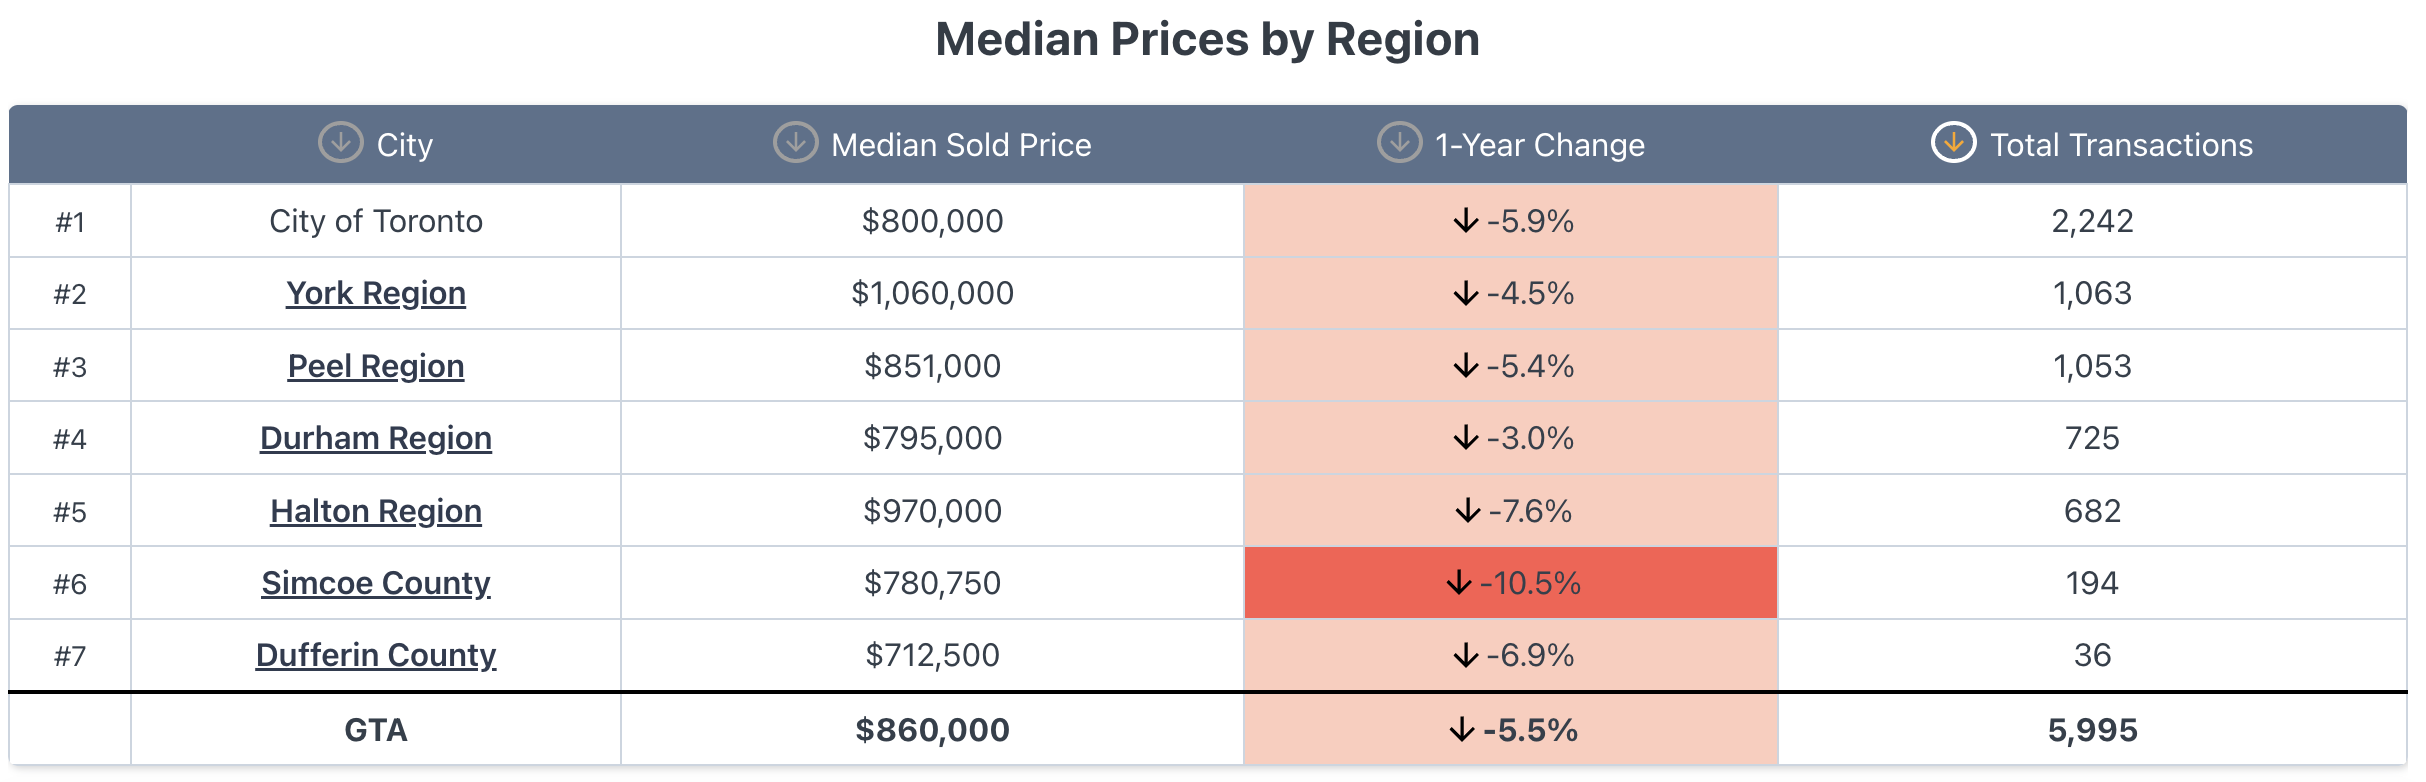
The average sold price across all property types in the GTA for July 2026 was $1,003,956, down 4.5% from July 2025 and down 5.2% from June 2026. The median sold price was $860,000, down 5.5% year-over-year. The MLS® Home Price Index (HPI) benchmark price was $934,600, down 4.6% year-over-year and down 0.7% from June 2026.
These are two different measurements. The average and median prices are calculated directly from the sale prices of homes that sold in a given month. Both figures move based on which homes transacted — if more lower-priced homes sell in a given month, the average and median will drop even if no individual home lost value. The benchmark price is calculated differently: it estimates the value of a home with a fixed, typical set of features (size, location, age, etc.) for a given area, and tracks how that estimated value changes month to month. Because it holds the type of home constant, it is less affected by shifts in what happened to sell.
The gap between the two measures in July — a 5.2% monthly drop in average price against a 0.7% monthly drop in benchmark price — indicates that a larger share of lower-priced homes sold in July relative to June, rather than a broad decline in the value of individual homes.
GTA Average Sold Price vs. MLS HPI Benchmark Price [DETACHED]
GTA Sales and Listings Activity
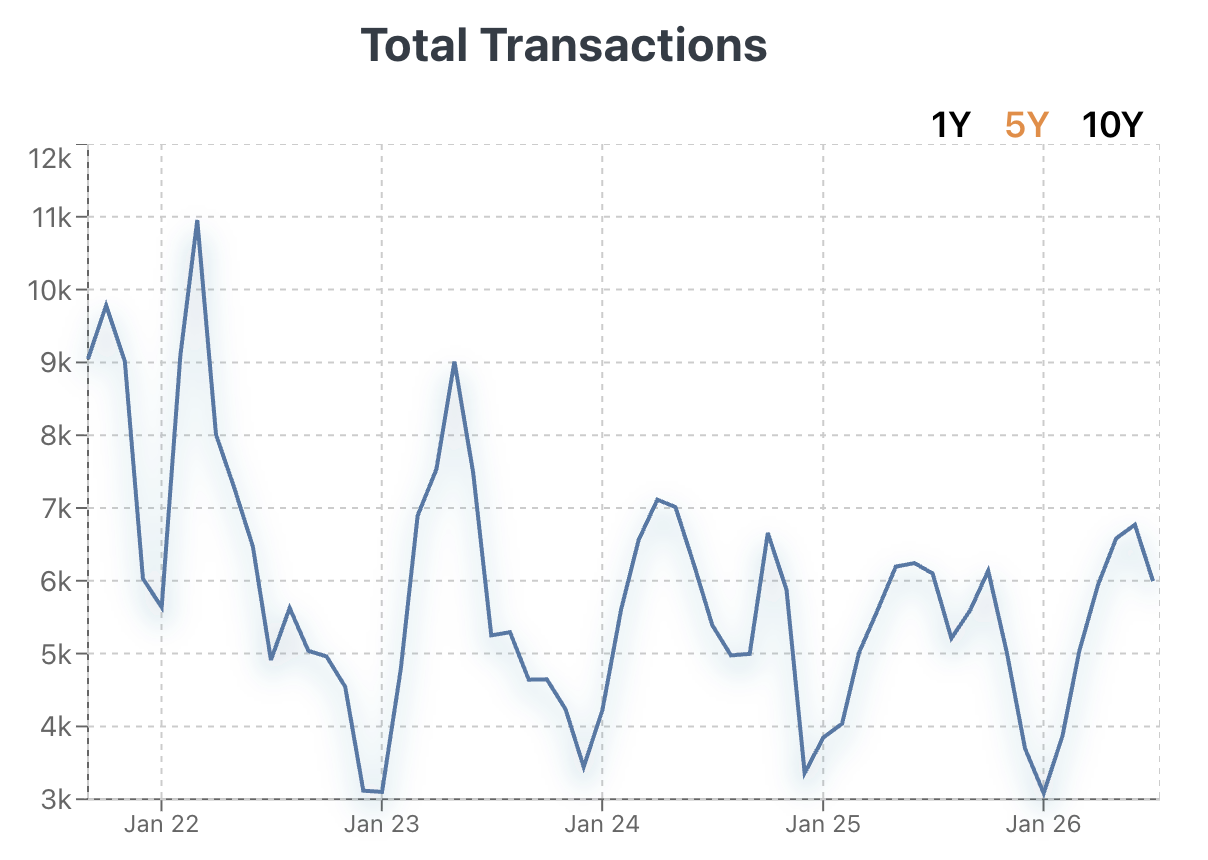
GTA sales totalled 5,995 in July 2026, down 1.7% from July 2025 and down 11.4% from June 2026 on an unadjusted basis. New listings totalled 14,484, down 17.8% year-over-year and down 16.2% month-over-month. Active listings at month-end were 26,098, down 12.1% from a year earlier and down 4.5% from June.
The sales-to-new-listings ratio (SNLR) was 41.4%, up from 39.2% in June 2026 and 34.6% in July 2025. Months of supply was 4.4, up from 4.0 in June 2026 but down from 4.9 in July 2025. TRREB and CREA generally classify 3 to 5 months of supply as a balanced market. By this measure, the GTA remained balanced in July, with tighter conditions than a year earlier.
The average sale-to-list price ratio was 97%. Average listing days on market were 32, up from 30 in July 2025. Average property days on market were 45, up from 41 a year earlier.
City of Toronto
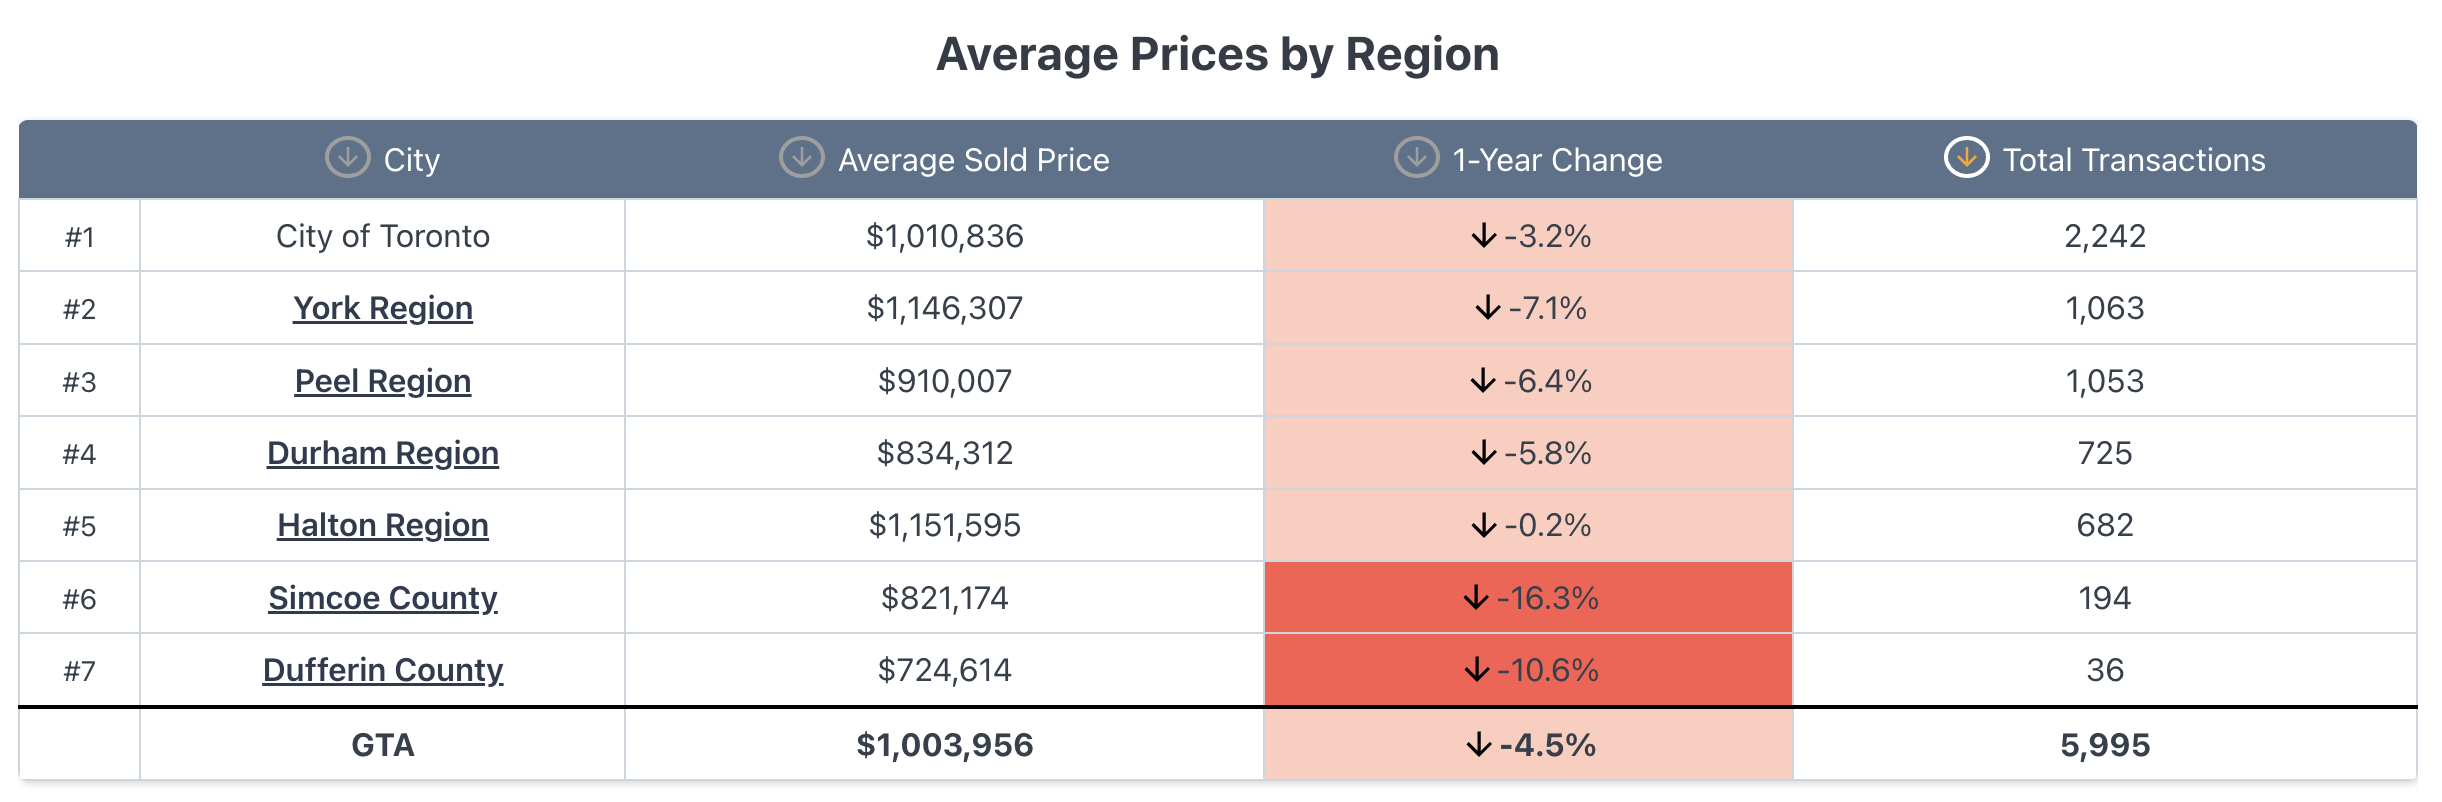
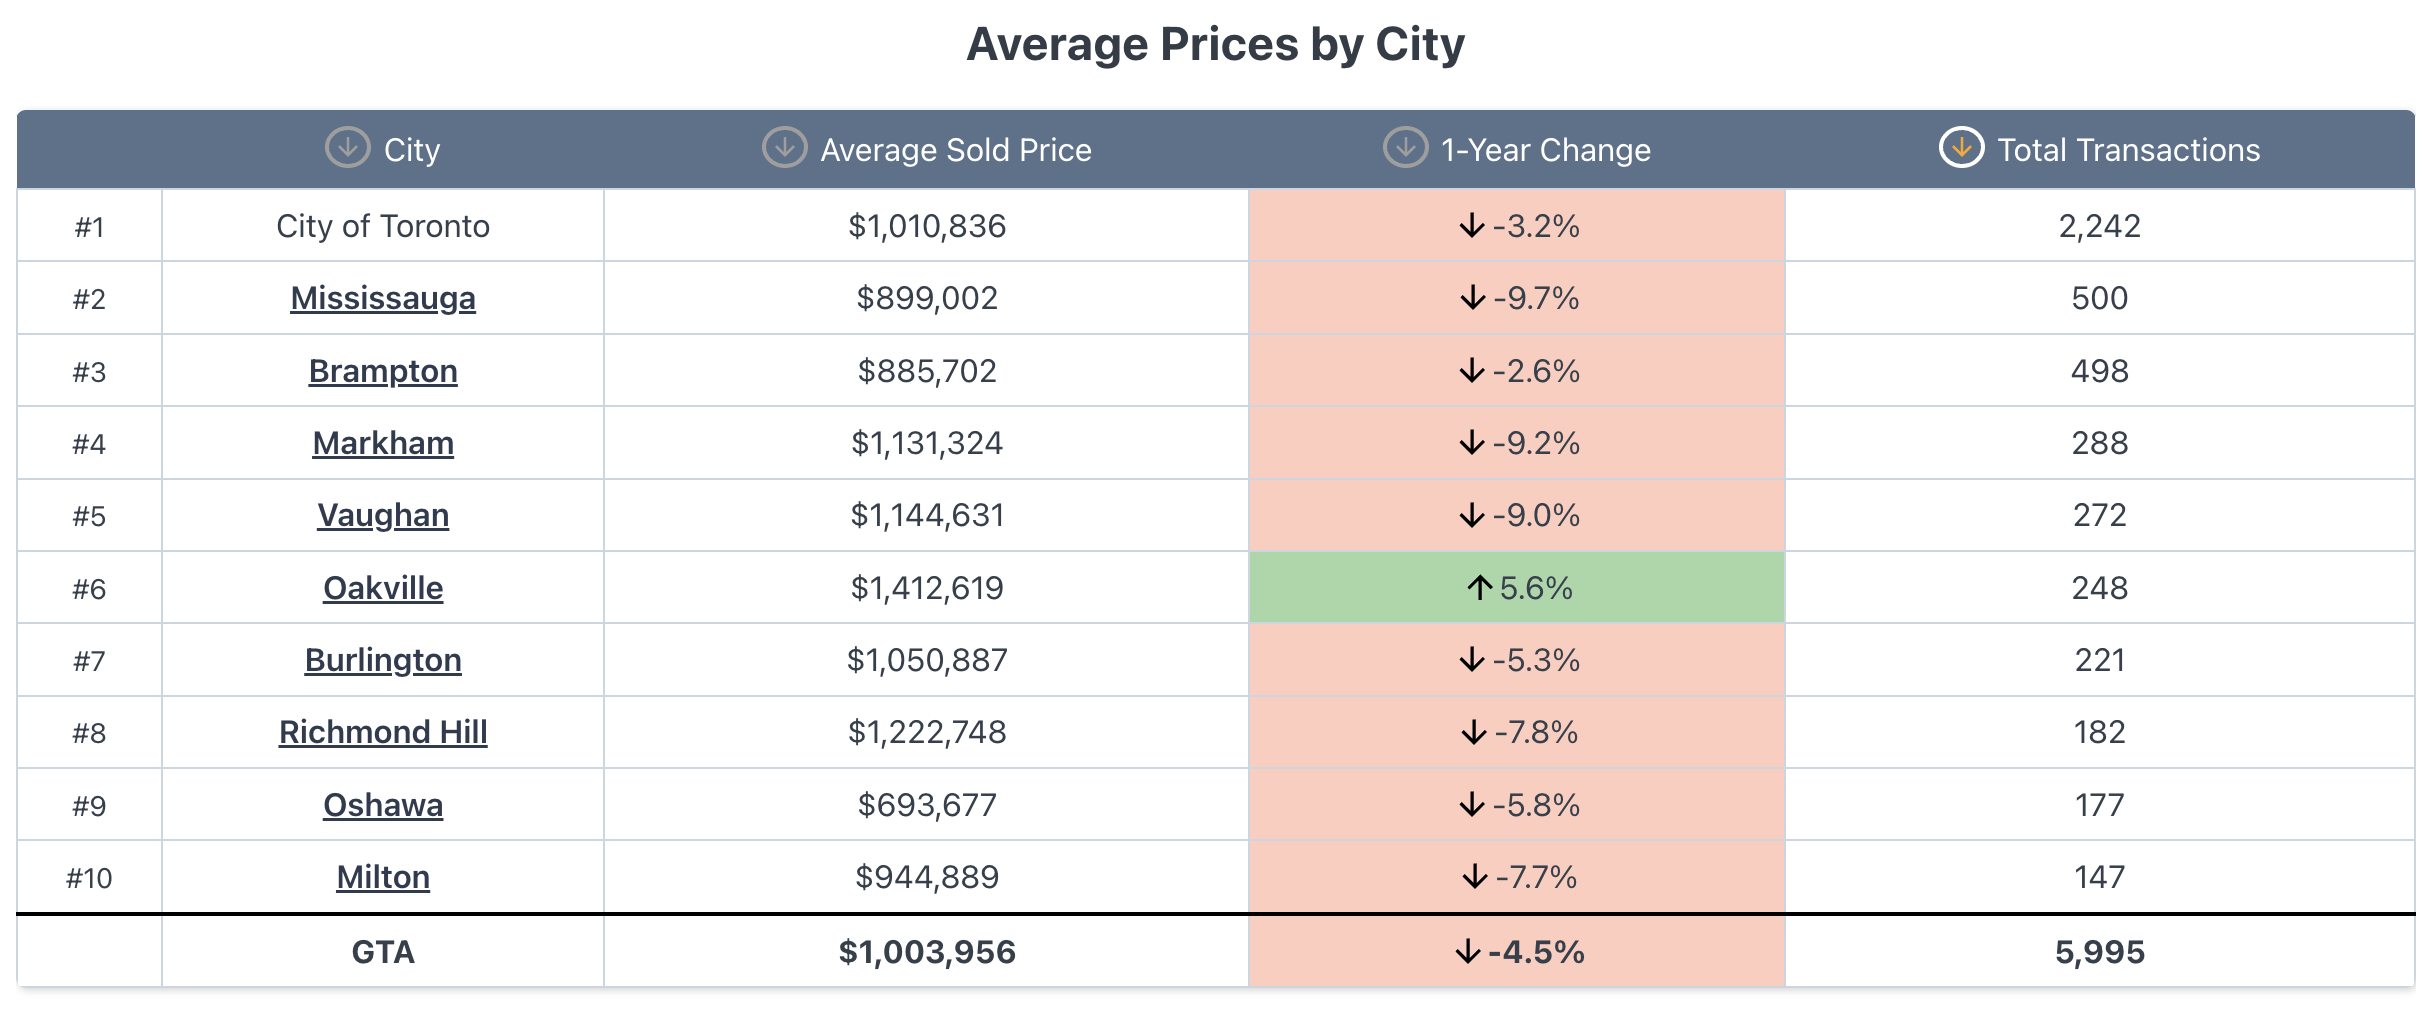
Within the City of Toronto specifically, the average sold price was $1,010,836, down 6.5% from June 2026 and down 3.2% year-over-year. The benchmark price was $928,200, down 0.6% month-over-month and 3.8% year-over-year. The median price was $800,000, down 4.2% monthly and 5.9% year-over-year.
City of Toronto sales totalled 2,242, down 8.2% from June 2026 but up 1.7% from July 2025. New listings fell to 4,980, down 18.3% monthly and 17.1% annually. Active listings were 9,310, down 7.3% monthly and 14.8% annually. The sales-to-new-listings ratio rose to 45.0%, up from 40.1% in June 2026 and 36.7% in July 2025. Months of supply was approximately 4.2. Average sale-to-list ratio was 97%, with 32 listing days and 37 property days on market.
Average Sold Price by Region - Toronto, Burlington, Hamilton, GTA
Hamilton-Burlington Region
RAHB reported an average sold price of $741,172 for the Hamilton Region in July 2026, down 3.4% from July 2025 and down 0.7% from June 2026. Sales totalled 500 in the Hamilton Region and 798 across the full Hamilton-Burlington market area. New listings totalled 1,019 in the Hamilton Region and 1,597 across Hamilton-Burlington. The sales-to-new-listings ratio in the Hamilton Region was 49%, with 4.7 months of supply — also within the balanced range. Average days on market were 42.
Average sold price by sub-region in Hamilton-Burlington for July 2026:
Hamilton: $741,172 (-3.4% year-over-year)
Burlington: $1,042,388 (-5.7% year-over-year)
Haldimand: $639,022 (-1.2% year-over-year)
Niagara North: $820,699 (+6.8% year-over-year)
RAHB's report did not break out Oakville as a separate sub-region; Oakville sales are captured within TRREB's broader GTA and Halton region figures rather than the Hamilton-Burlington dataset above.
Property Type Breakdown — GTA
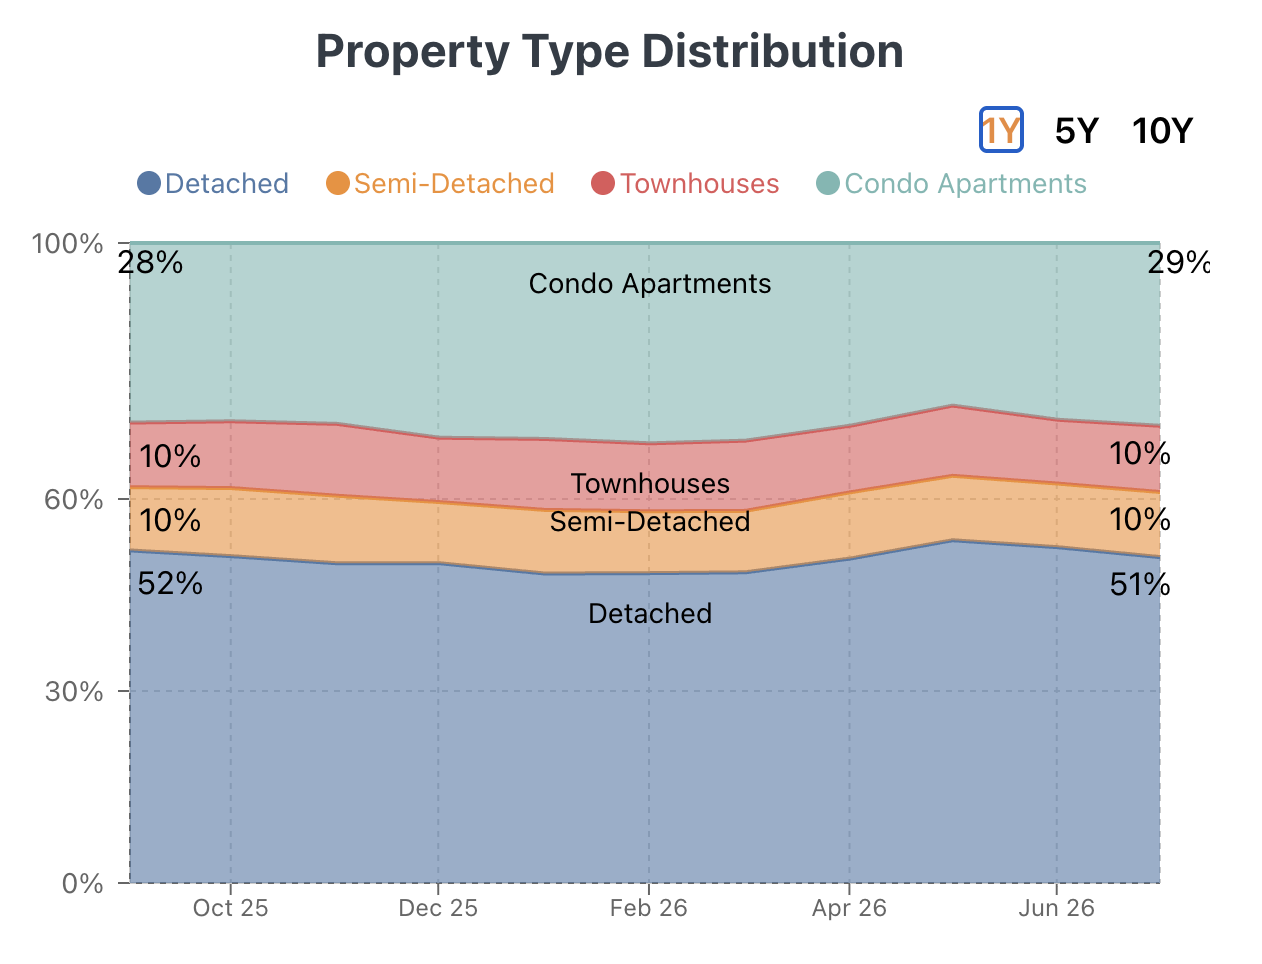
Detached: average price $1,291,690, down 5.3% monthly and 5.1% year-over-year. Sales of 2,789 were roughly unchanged from July 2025.
Semi-detached: average price $964,922, down 7.1% monthly and 7.3% year-over-year. Sales of 557, down 6.5% year-over-year — the largest annual price decline among the major property types.
Freehold townhouse: average price $903,986, down 0.9% monthly and 2.7% year-over-year. Sales of 567, down 4.9% year-over-year.
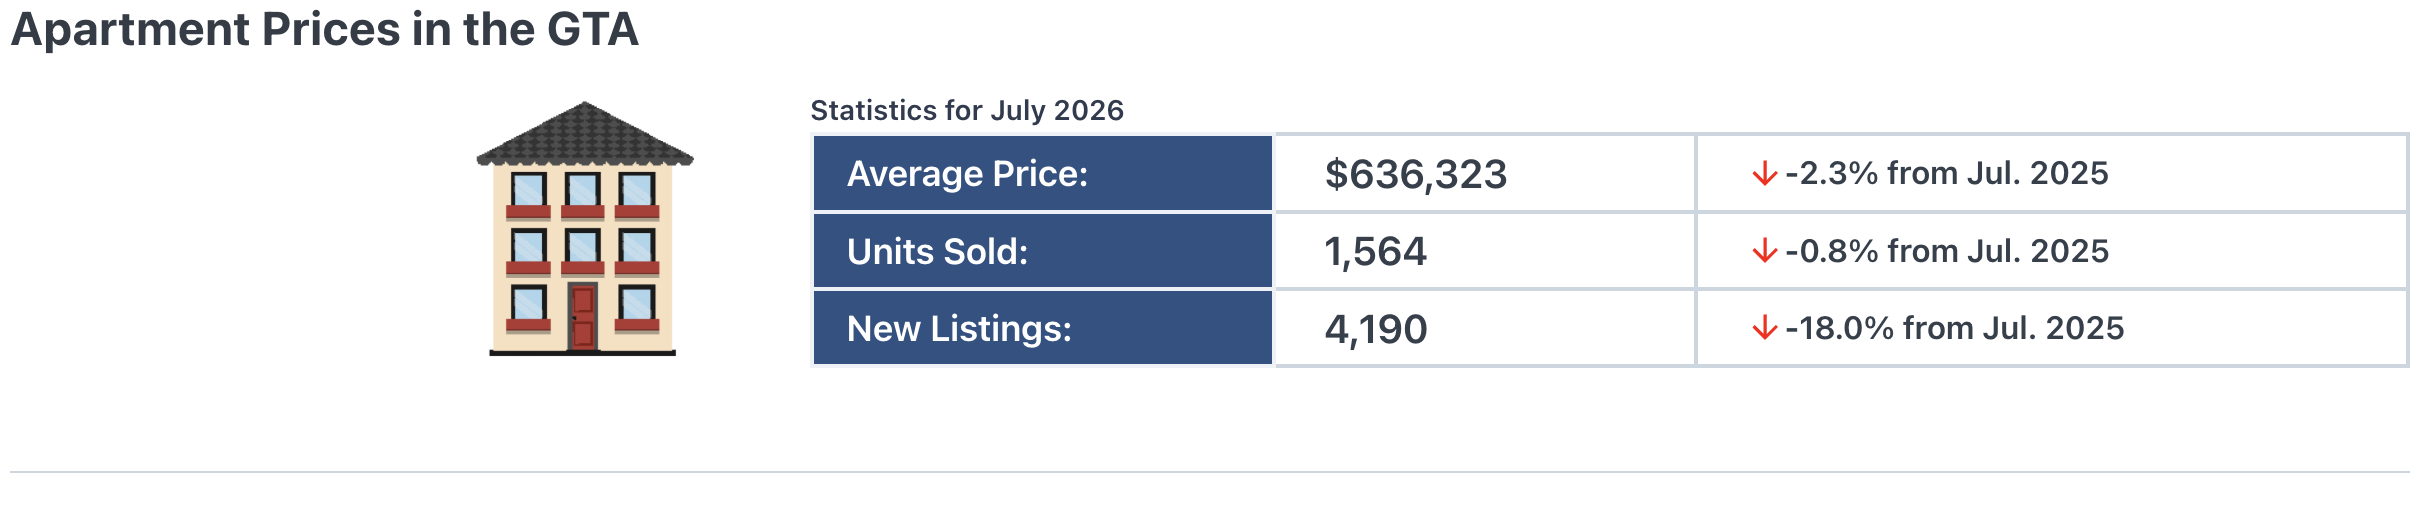
Condo apartment: average price $636,323, up 0.9% monthly and down 2.3% year-over-year — the smallest year-over-year decline of the major categories. Sales of 1,564, roughly flat year-over-year.
Condo townhome: average price $704,367, down 6.6% monthly and 5.3% year-over-year. Sales of 436, down 3.3% year-over-year.
Property Type Breakdown — Hamilton Region
Detached: average price $846,864, down 0.2% year-over-year.
Semi-detached: average price $602,770, down 3.7% year-over-year.
Townhouse: average price $599,743, down 6.9% year-over-year.
Condo apartment: average price $384,828, down 9.8% year-over-year.



Market Conditions Summary
Both the GTA and the Hamilton Region were classified as balanced markets in July 2026, with months of supply of 4.4 and 4.7 respectively. Both markets saw year-over-year declines in new listings outpace declines in sales, which pushed sales-to-new-listings ratios higher than a year earlier. Average sale-to-list price ratios remained at 97% in the GTA, and days on market increased slightly year-over-year in both regions.
TRREB's seasonally adjusted data showed sales increased from June while new listings declined, indicating that the month-over-month drop in raw sales volume reflects typical seasonal patterns rather than a change in underlying demand.
Get a Breakdown for Your Neighbourhood
The figures above are regional and sub-regional averages. They don't tell you what's happening on your specific street, in your specific price bracket, or in the neighbourhood you're considering moving to. If you want a detailed breakdown for your own neighbourhood — or one you're looking to buy into, in Burlington, Oakville, Hamilton, or elsewhere in the GTA — contact me directly and I'll pull the current numbers for that area.
Andrew McLellan, MCLELLAN Real Estate
(905) 464-0941 | Andrew@MclellanRealEstate.ca | mclellanrealestate.ca
