

This is a breakdown of what sold, what’s on the market and where prices stand in Hamilton for September 2026.
Sold Prices by Property Type

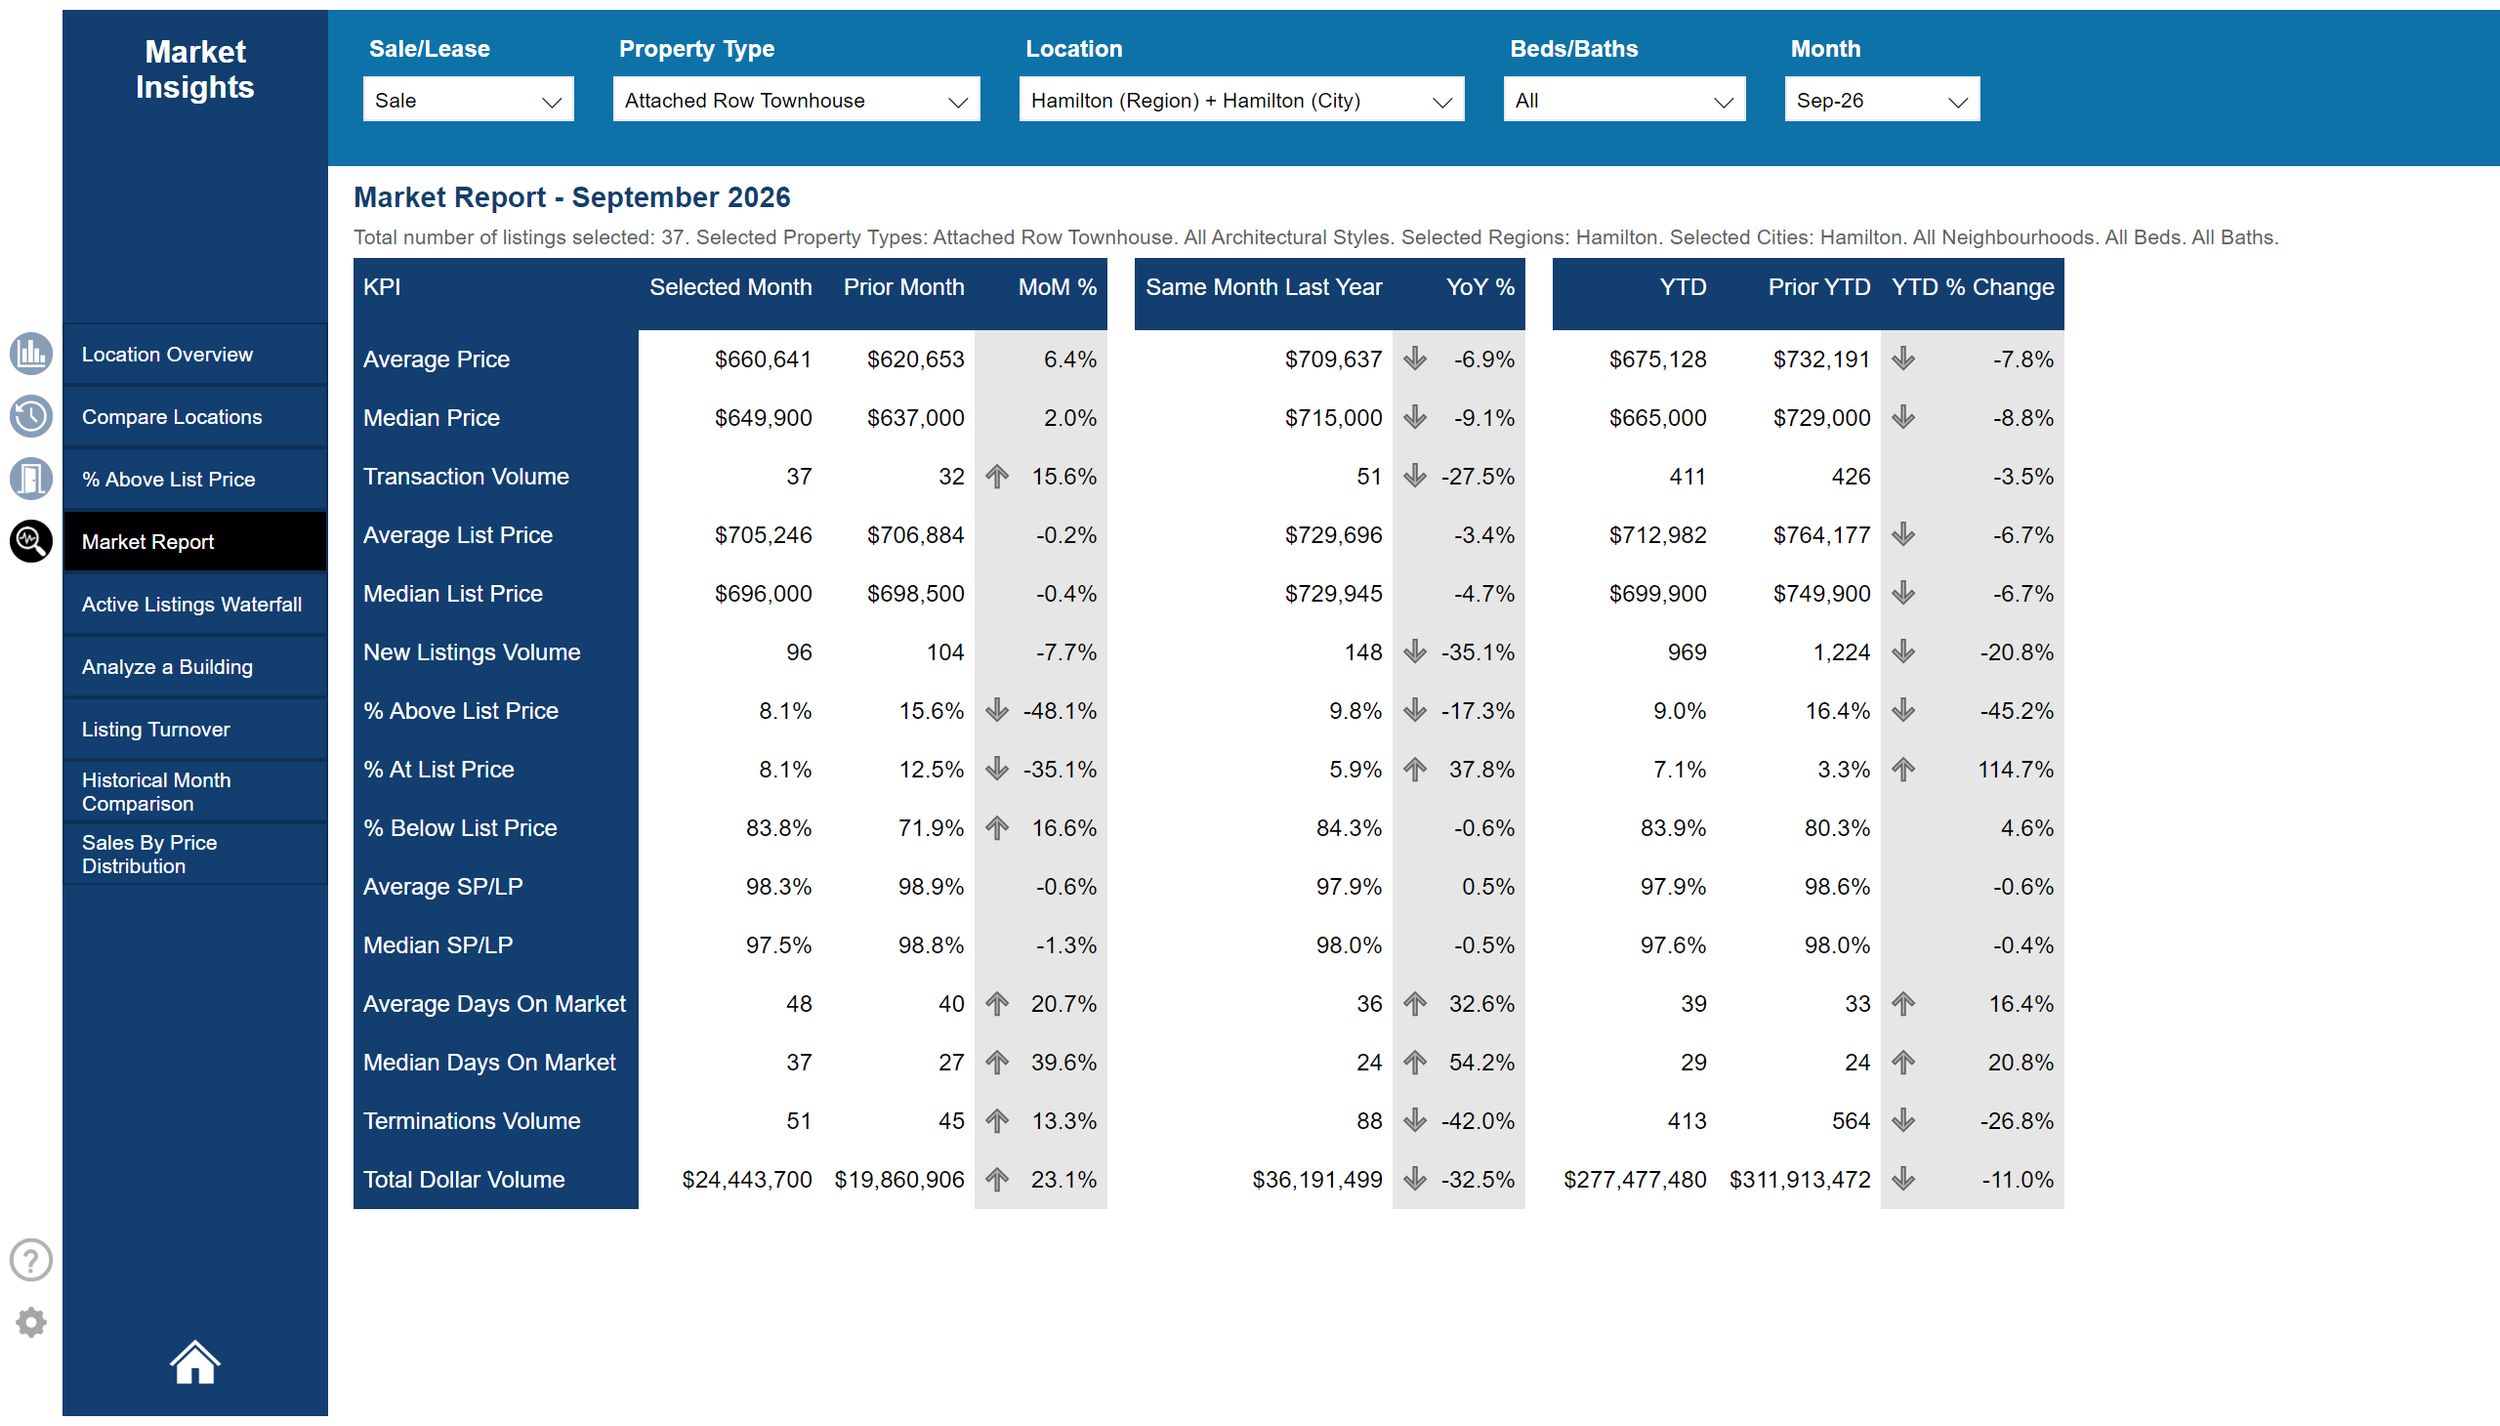
*Includes condo townhouses. Freehold and POTL (parcel of tied land) townhouses averaged up to $660,641.
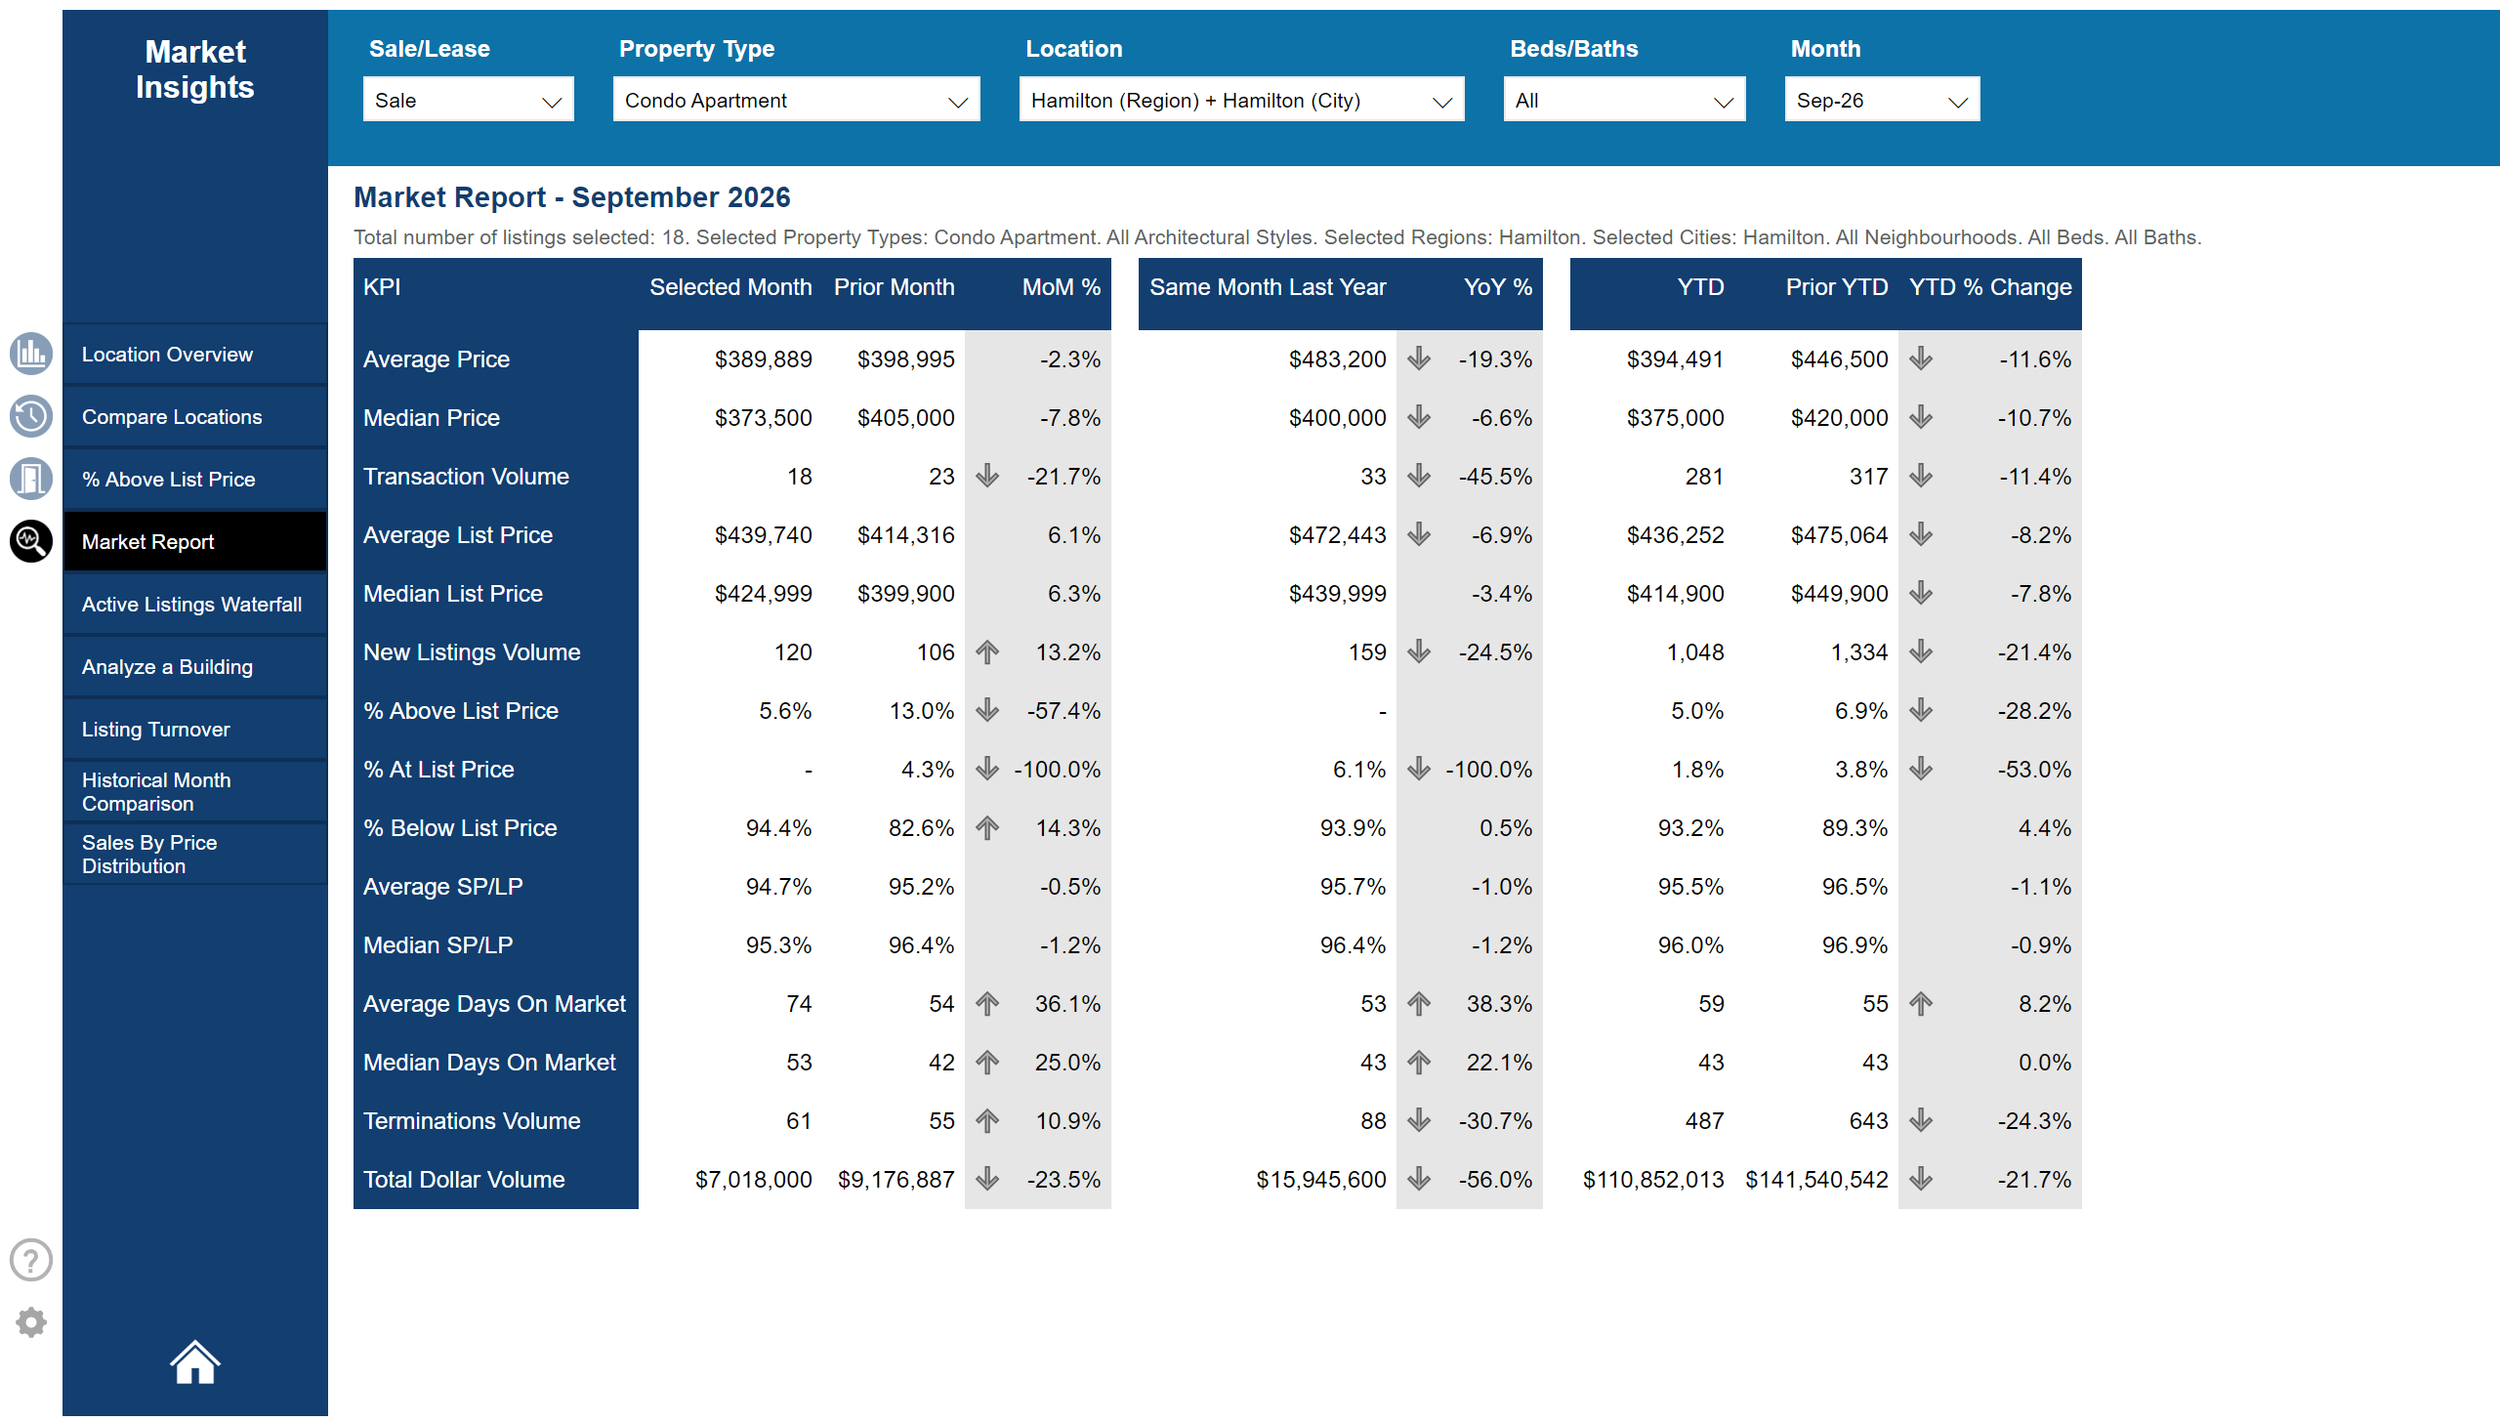
Sales counts by type cover detached, row townhouse and condo apartment sales only, so they don’t add up to the citywide total.
Citywide, the average sold price was $714,420. That is down 3% from August and 7.9% from September 2025, across 376 total sales.
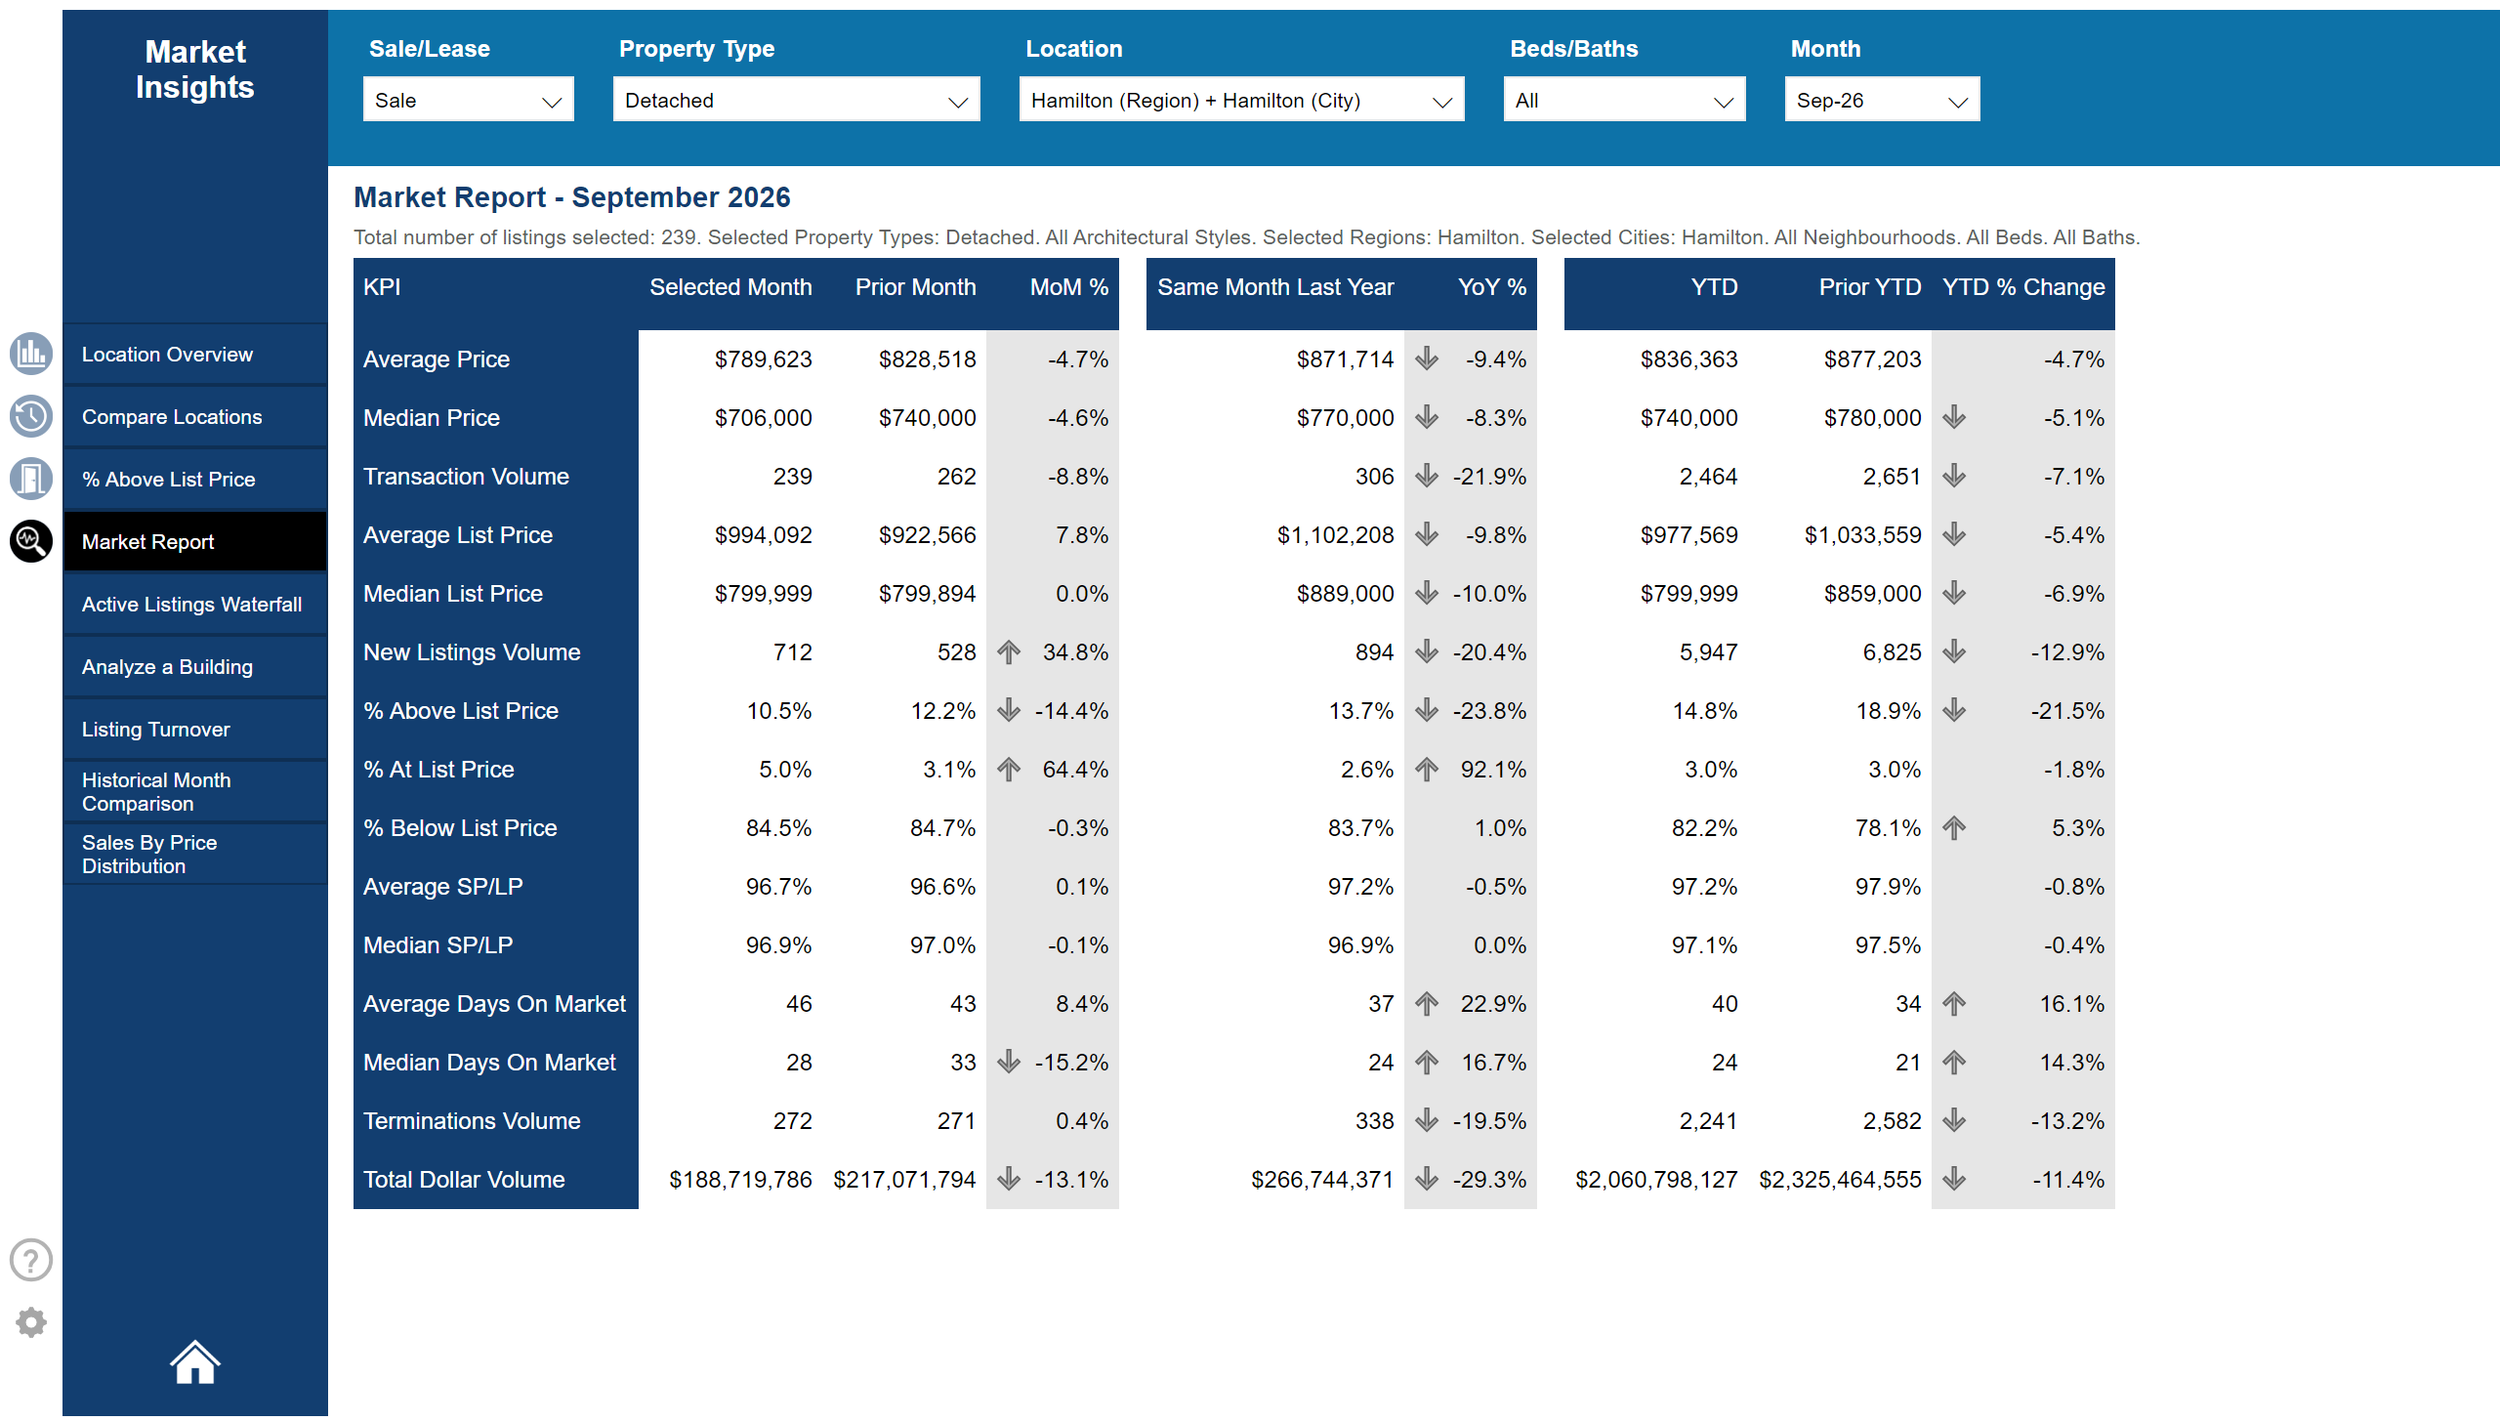
Detached Homes: A Closer Look
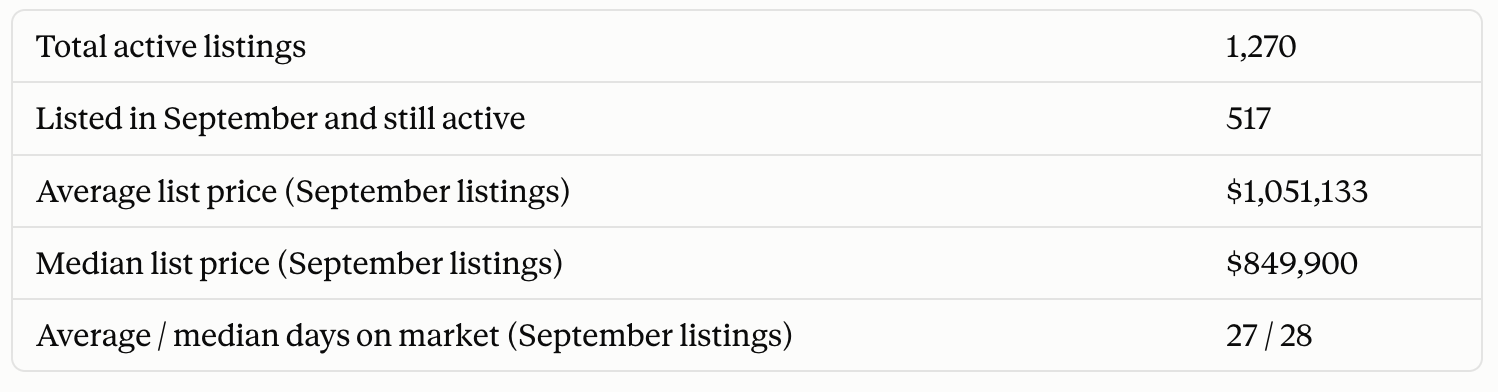
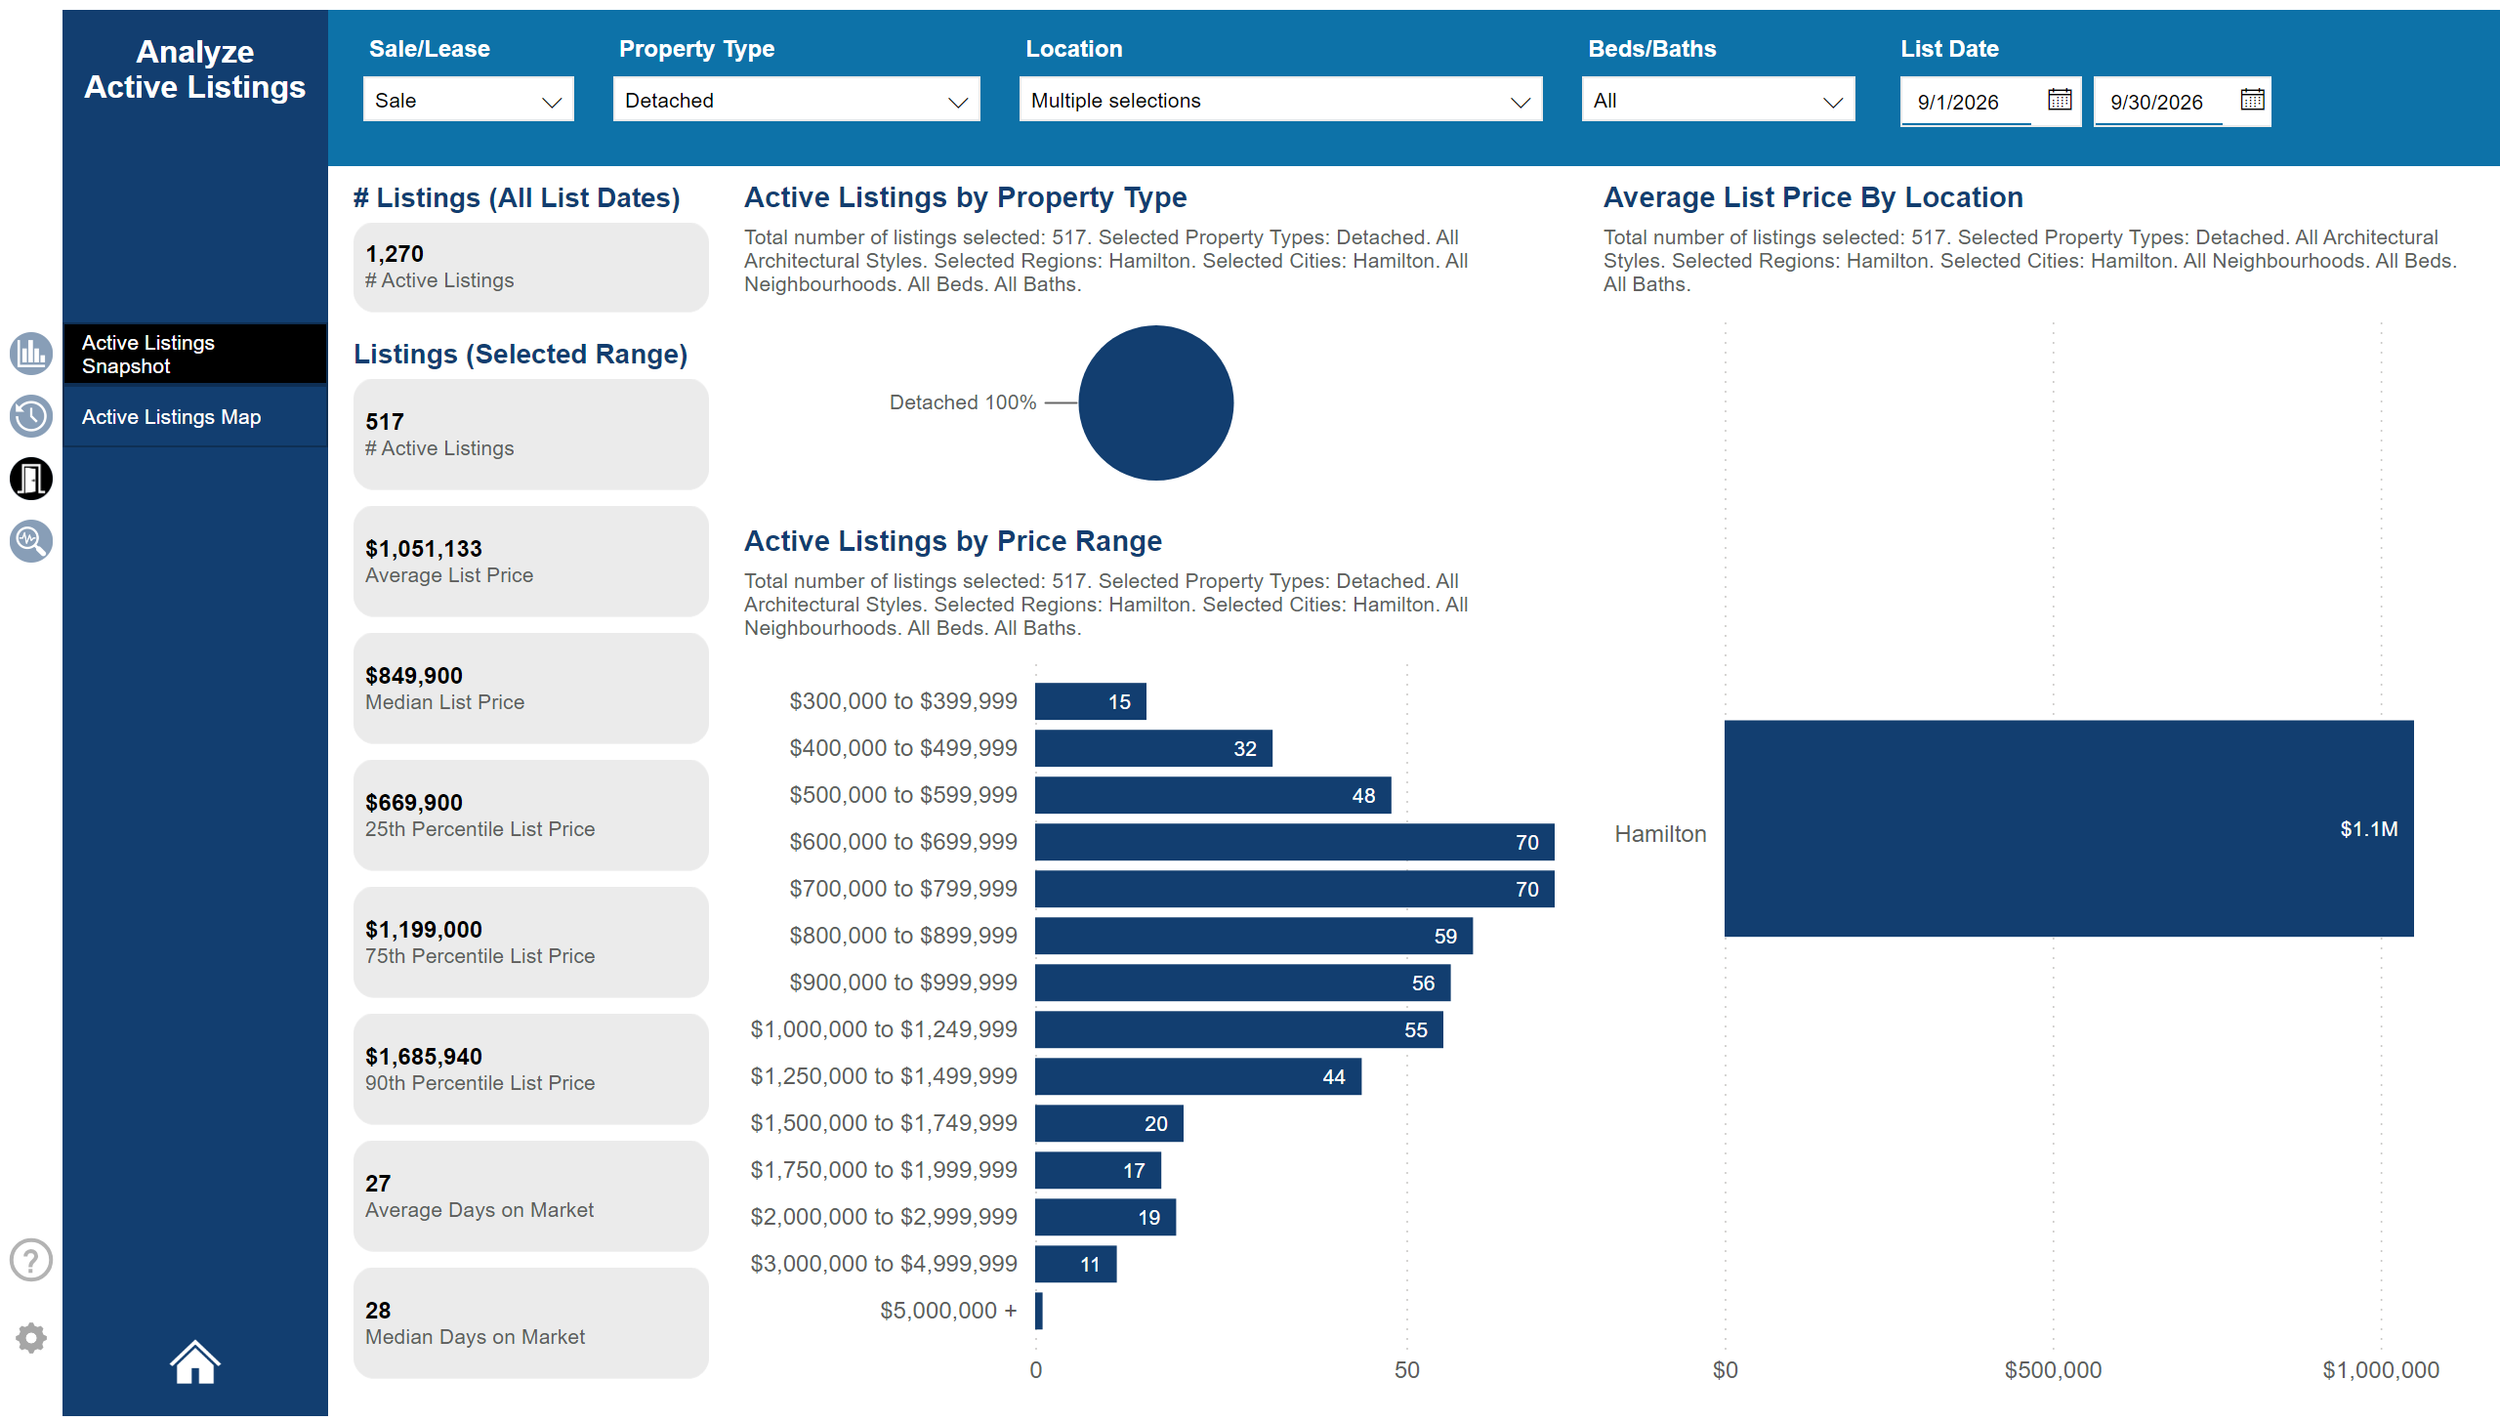
On the market
Sold in September
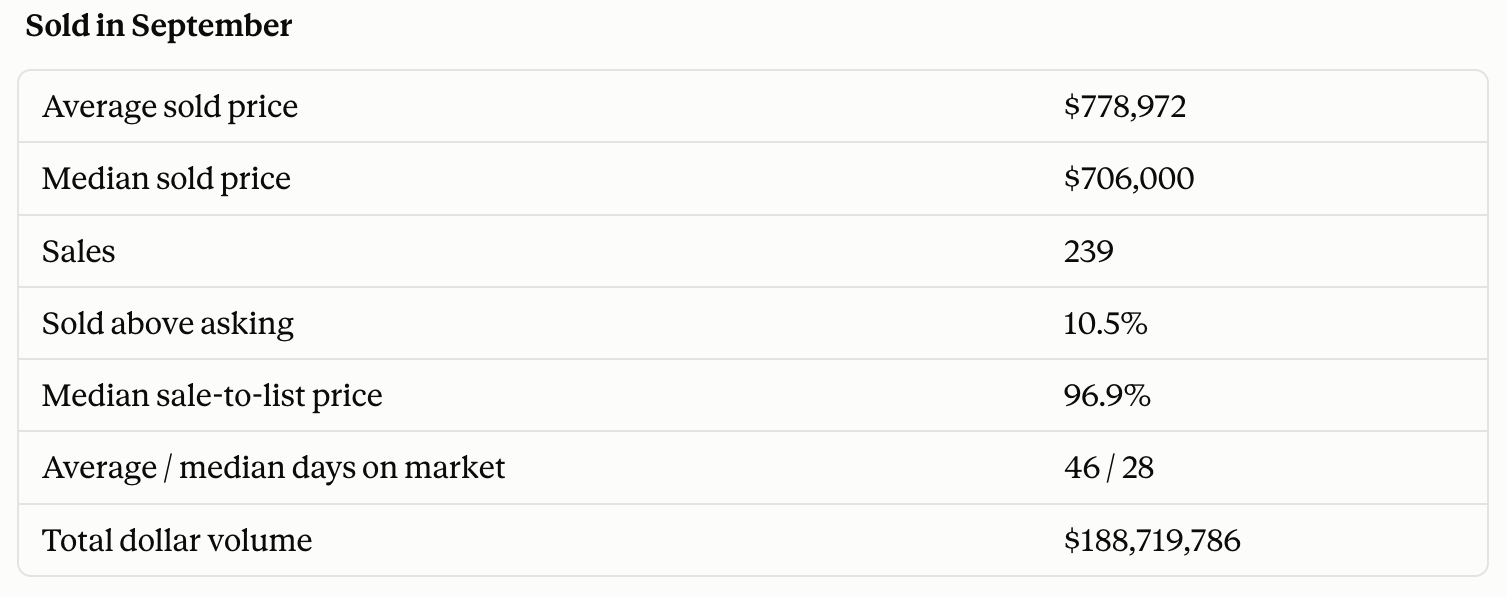
A median sale-to-list price of 96.9% means the typical detached home sold for about 3% under its asking price. Remember, big asterisk here as the Toronto Board hides the terminated listings. You need an agent to show you the true L/S ratio and DOM.
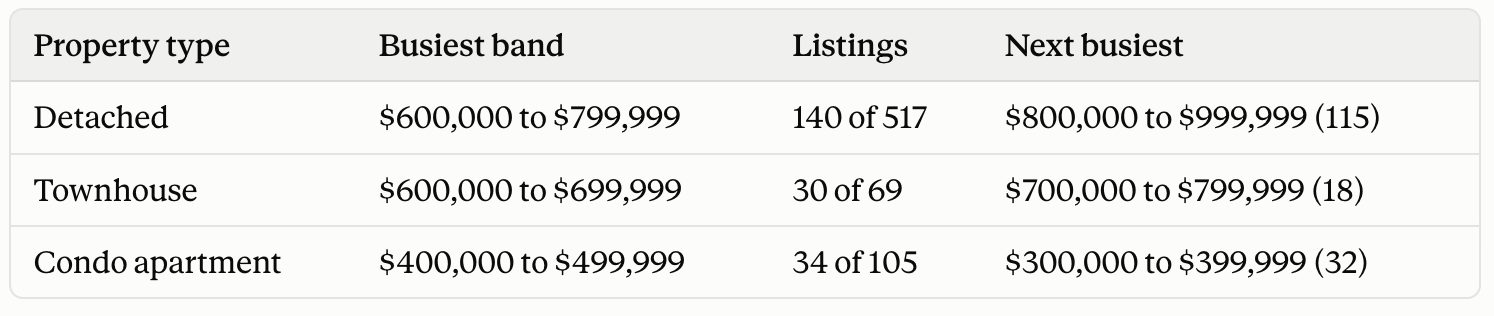
Where Buyers Are Shopping
These are the busiest price points among homes listed in September.
Benchmark Prices: Where We Stand
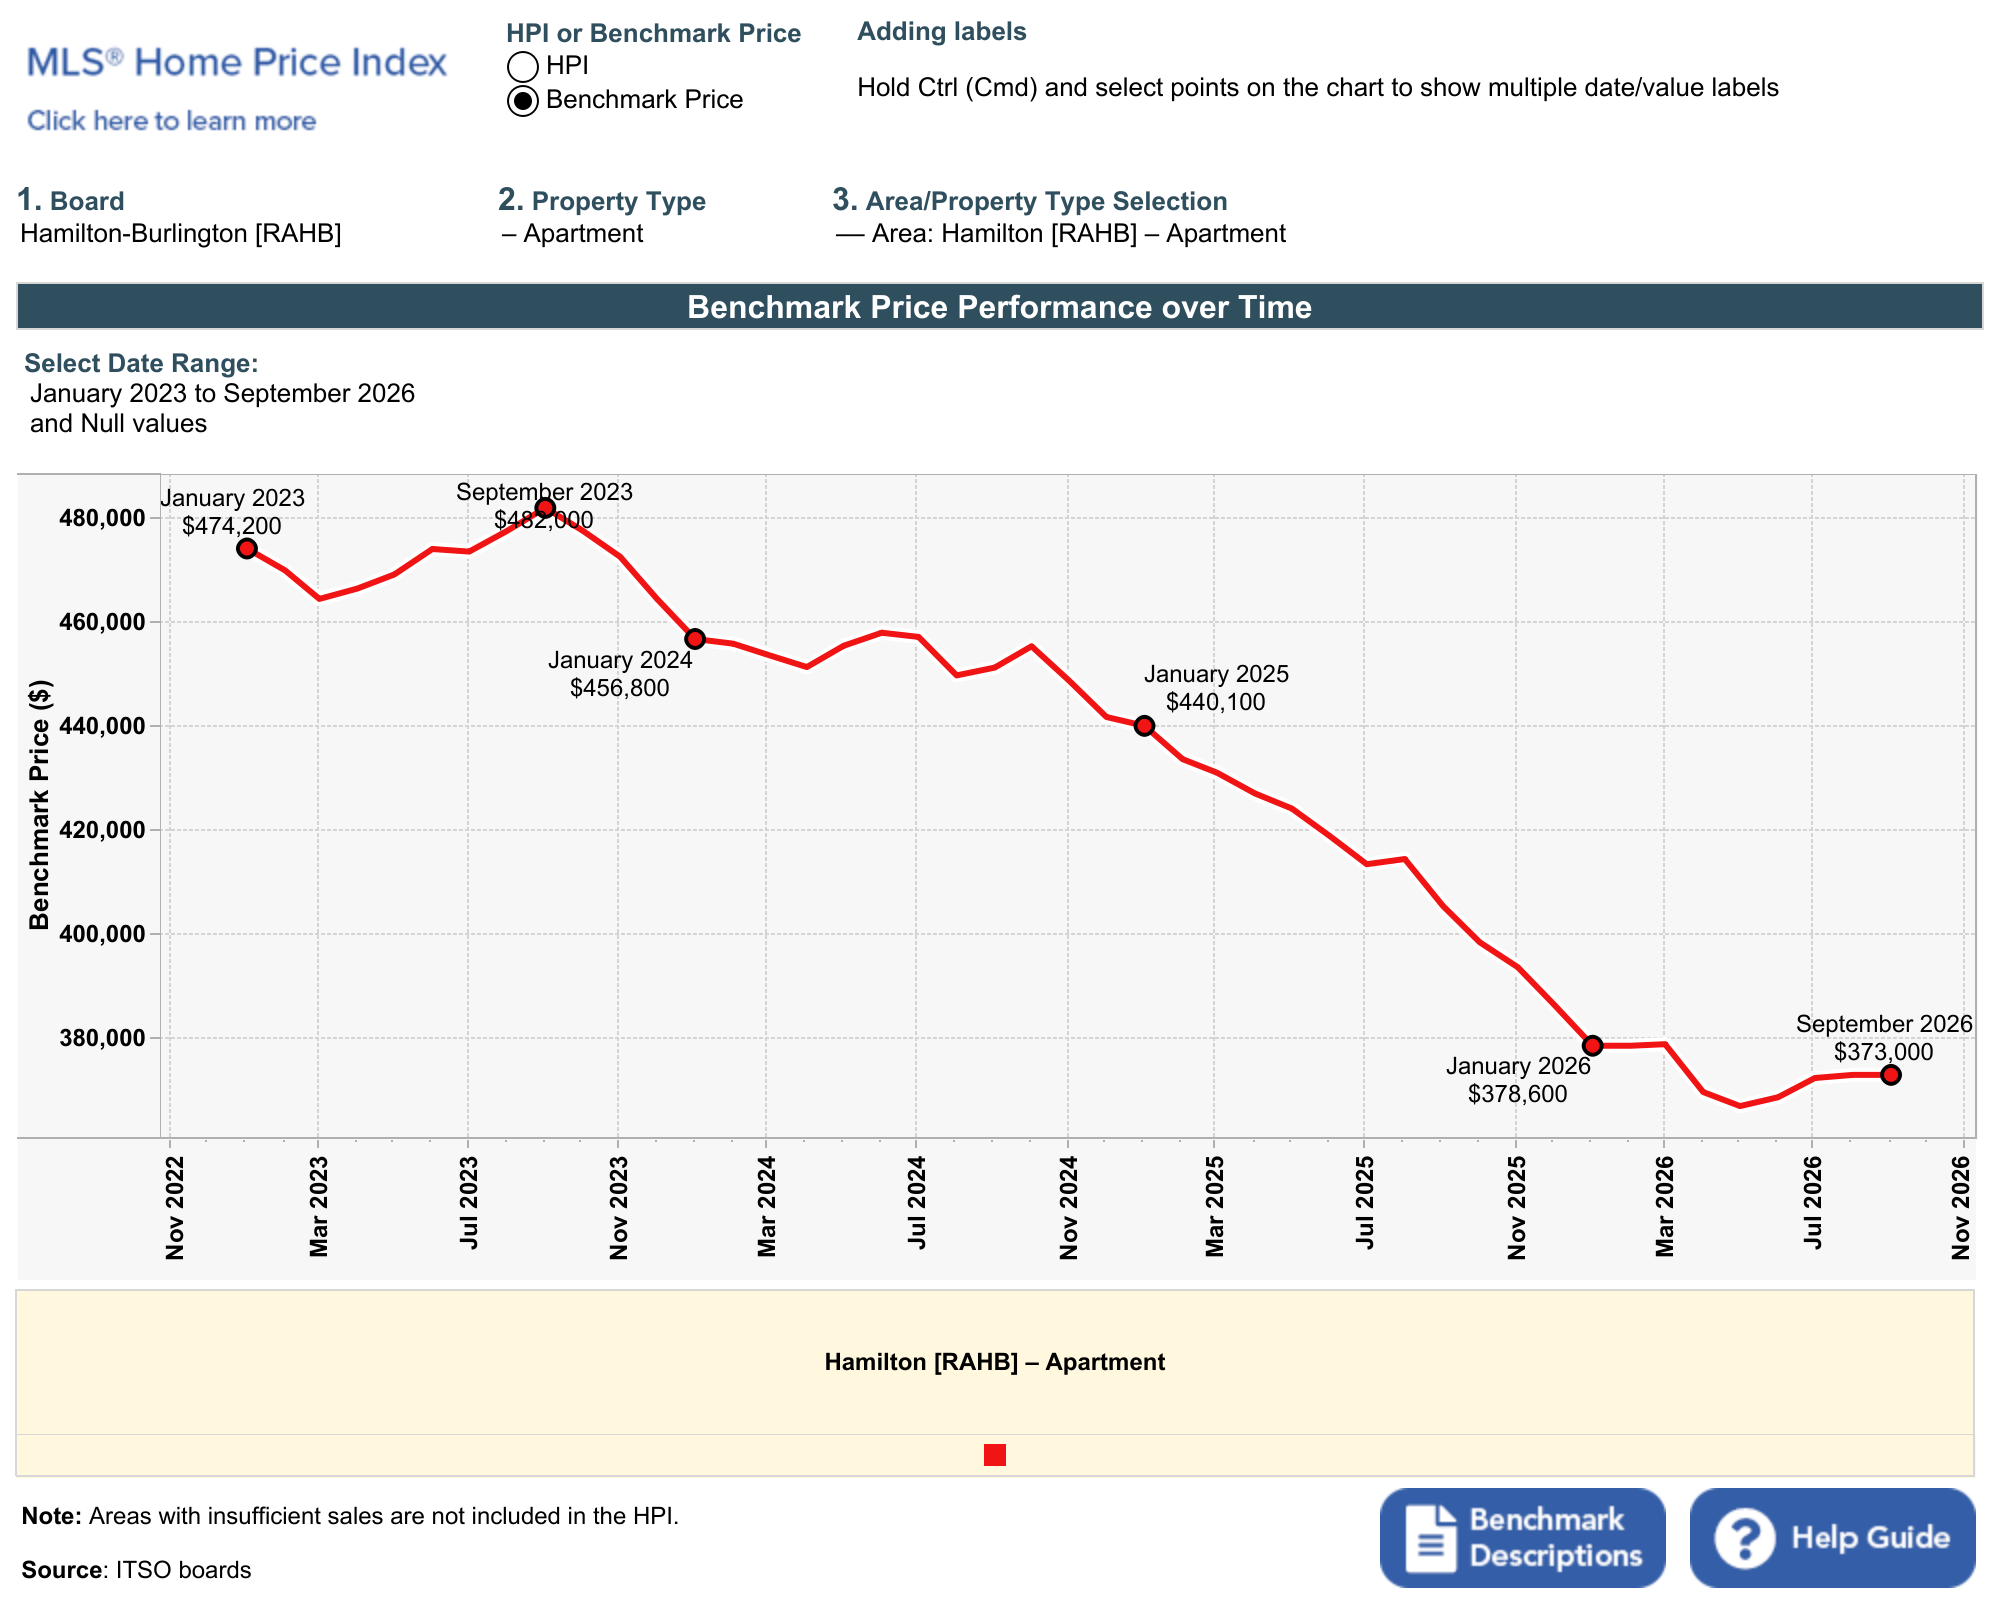
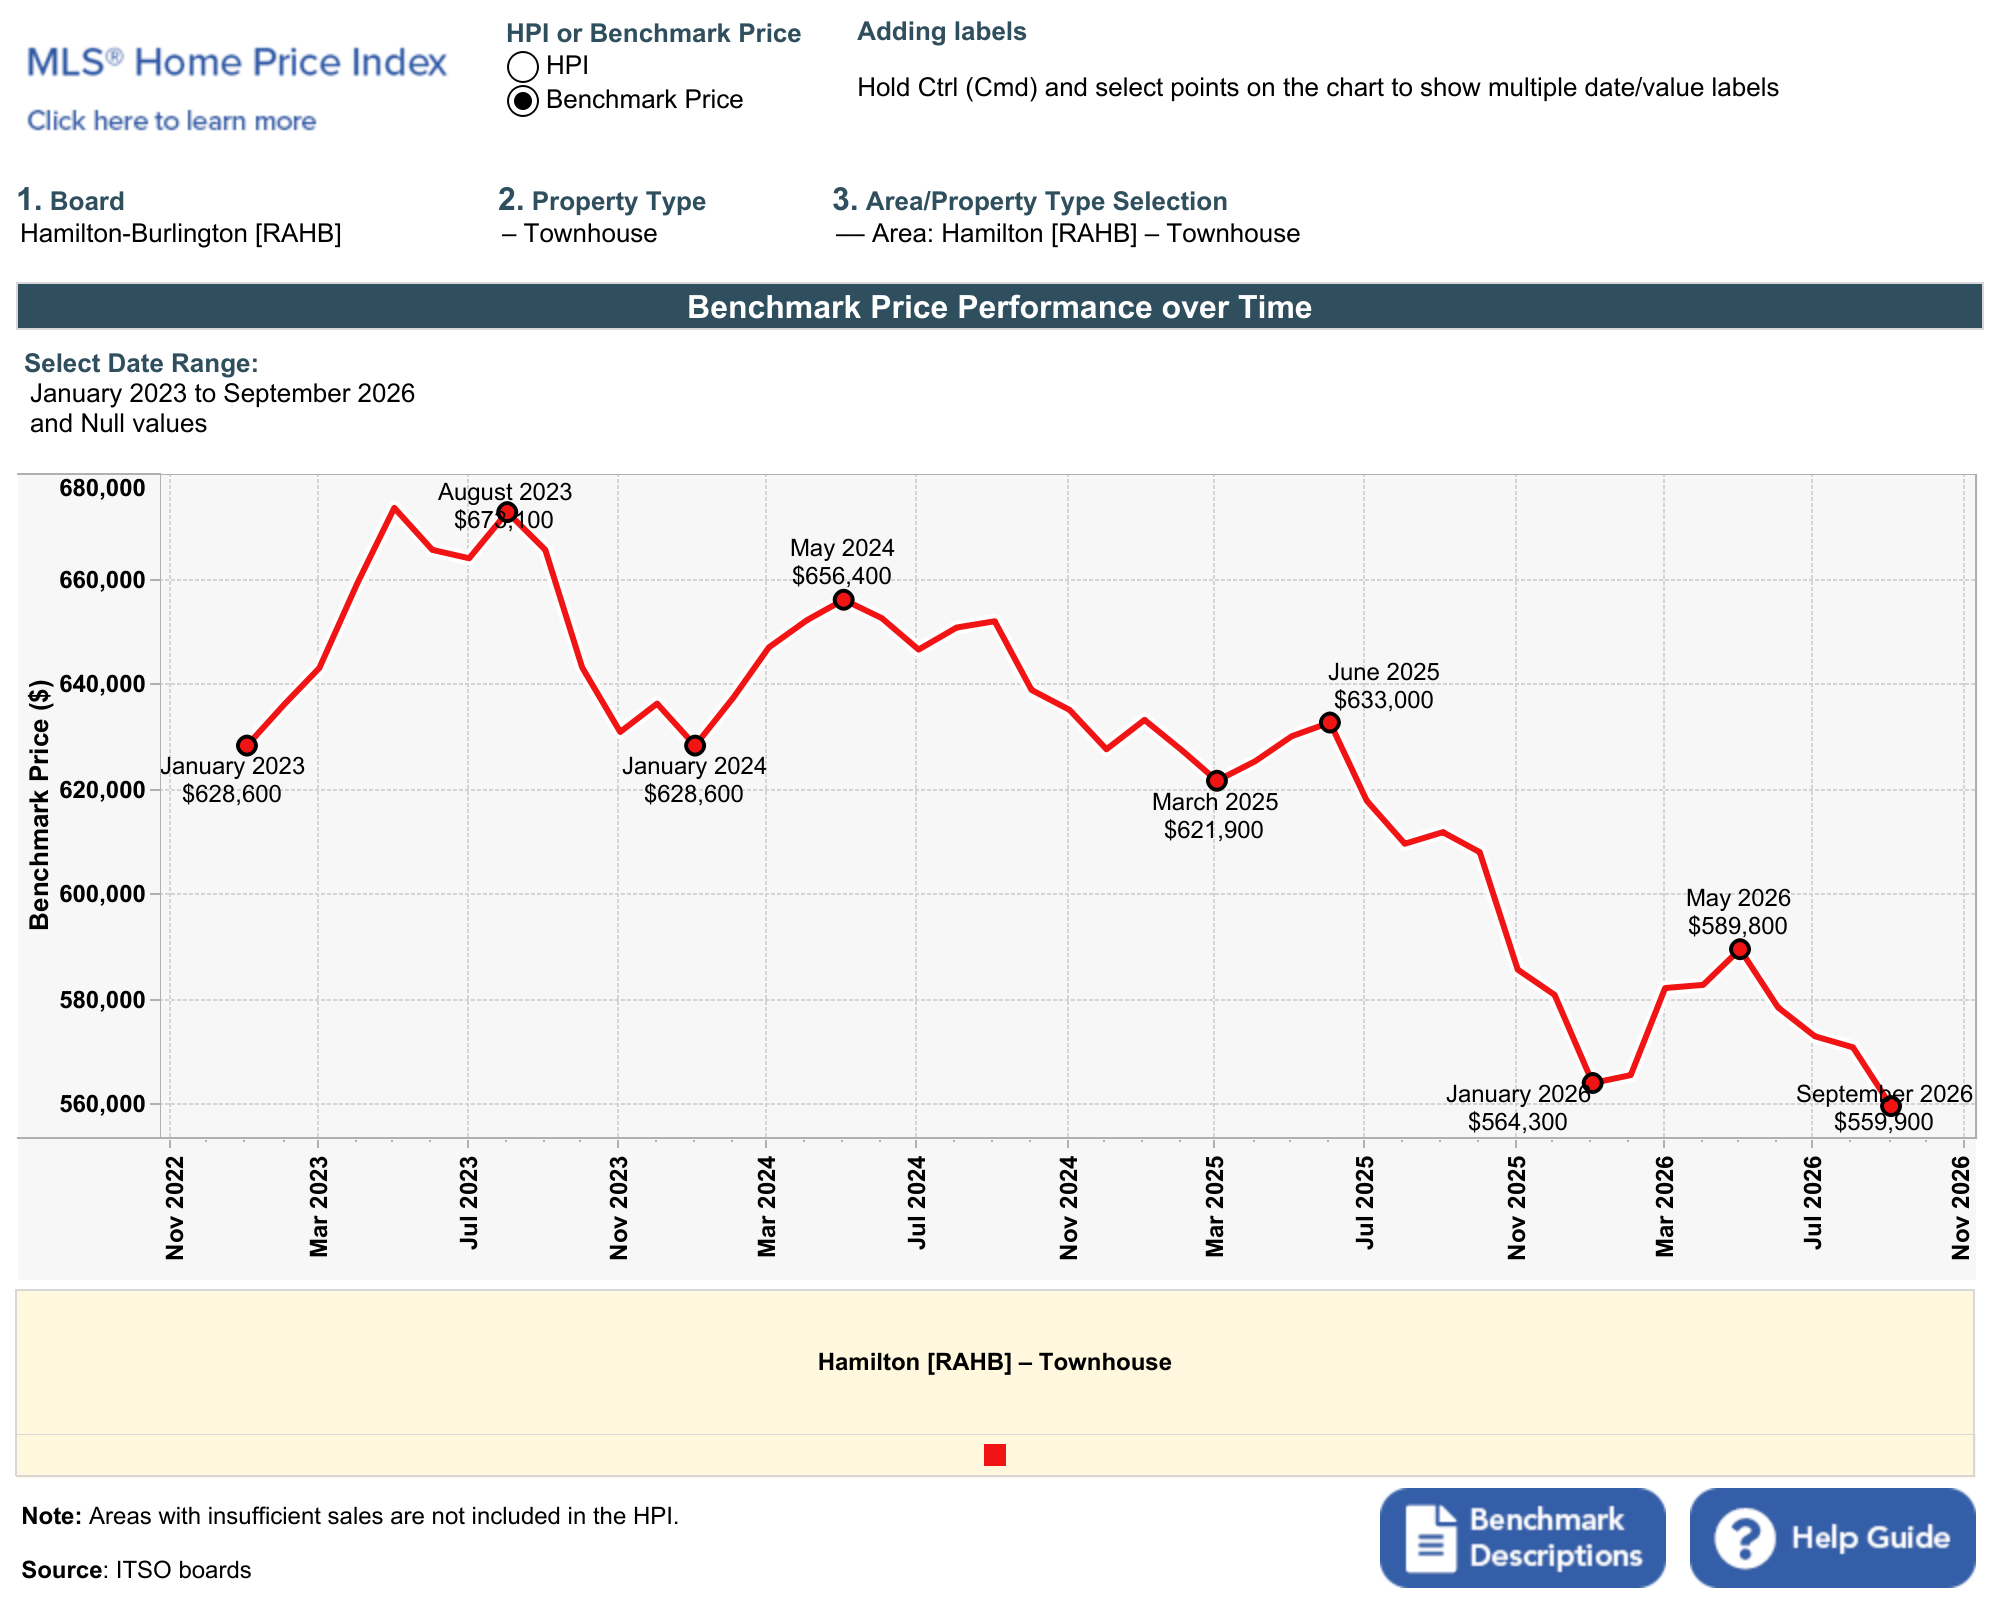
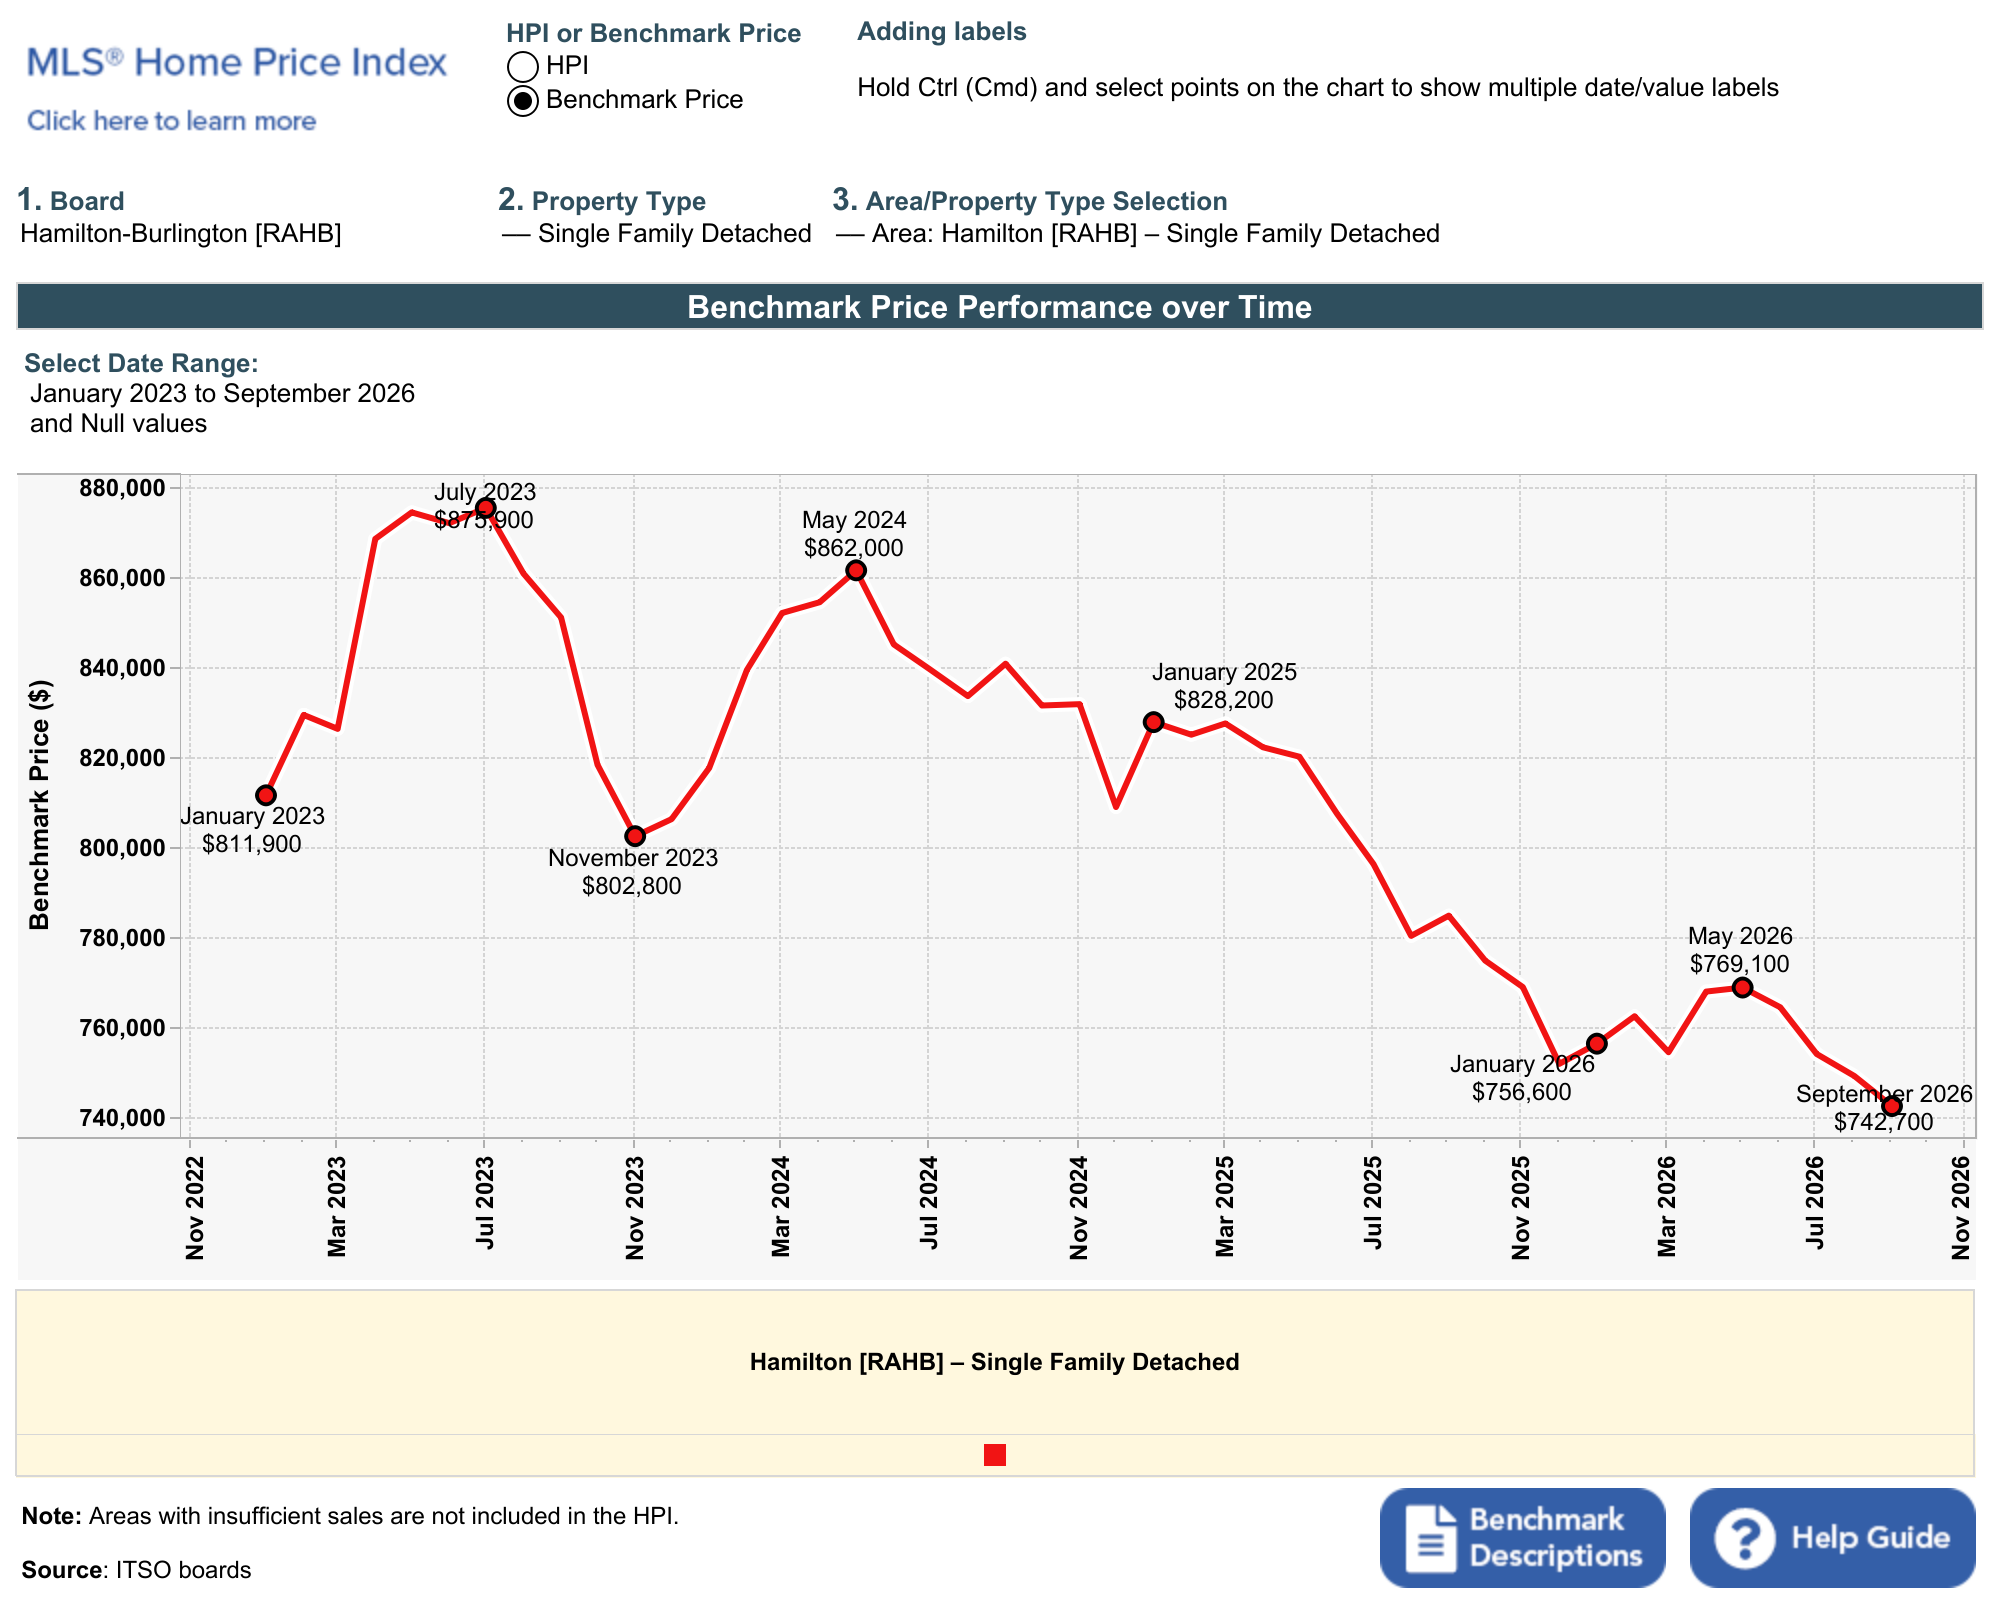
The benchmark price is the estimated value of a typical home in the area. Because it is an estimate of a typical home, it doesn’t jump around based on which homes happened to sell in a given month.
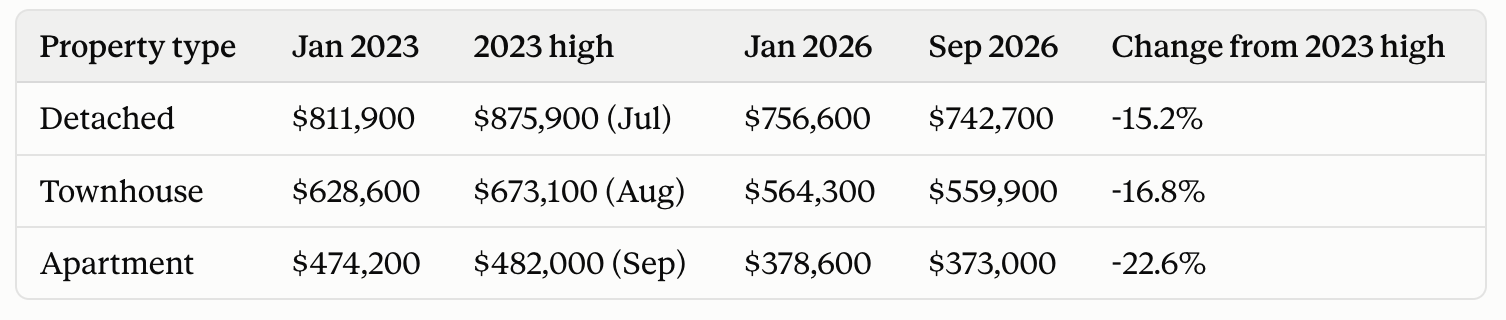
The detached and townhouse benchmarks rose this spring, reaching $769,100 and $589,800 in May 2026. Both eased back through September.
Where Hamilton Stands
Average prices for detached homes, townhouses and condos are lower than in September 2025. The benchmark for every property type is below where it started 2026 and well below its 2022 high.
Buyers have more to choose from. There were 712 new detached listings in September, up from 528 in August, and the market sits at 4.8 months of supply. That falls within the 3 to 5 month range generally considered balanced.
Homes are also taking longer to sell. Detached homes averaged 46 days on market, compared with 37 in September 2025, and 84.5% sold below asking.
The median is a better read on the typical sale than the average. The typical detached home sold for $706,000, below the average, because a smaller number of higher-priced sales pull the average up. One month is a short window, so any single figure here should be read alongside the months around it.
All of these are citywide numbers. Each Hamilton neighbourhood moves on its own, and two areas a few minutes apart can look very different.
What This Means for You
Citywide numbers show the overall picture, but they don’t tell the story of your street or your home. If you’re thinking about buying or selling, reach out and I’ll pull the numbers for your neighbourhood or your home.
Price It Right and Show It Well™
Andrew Mclellan
(905) 464-0941
Sources: WOWA.ca Hamilton Housing Market Report (updated October 9, 2026); Habistat Market Insights and Active Listings, Hamilton, September 2026; MLS® Home Price Index, RAHB (ITSO boards).
