

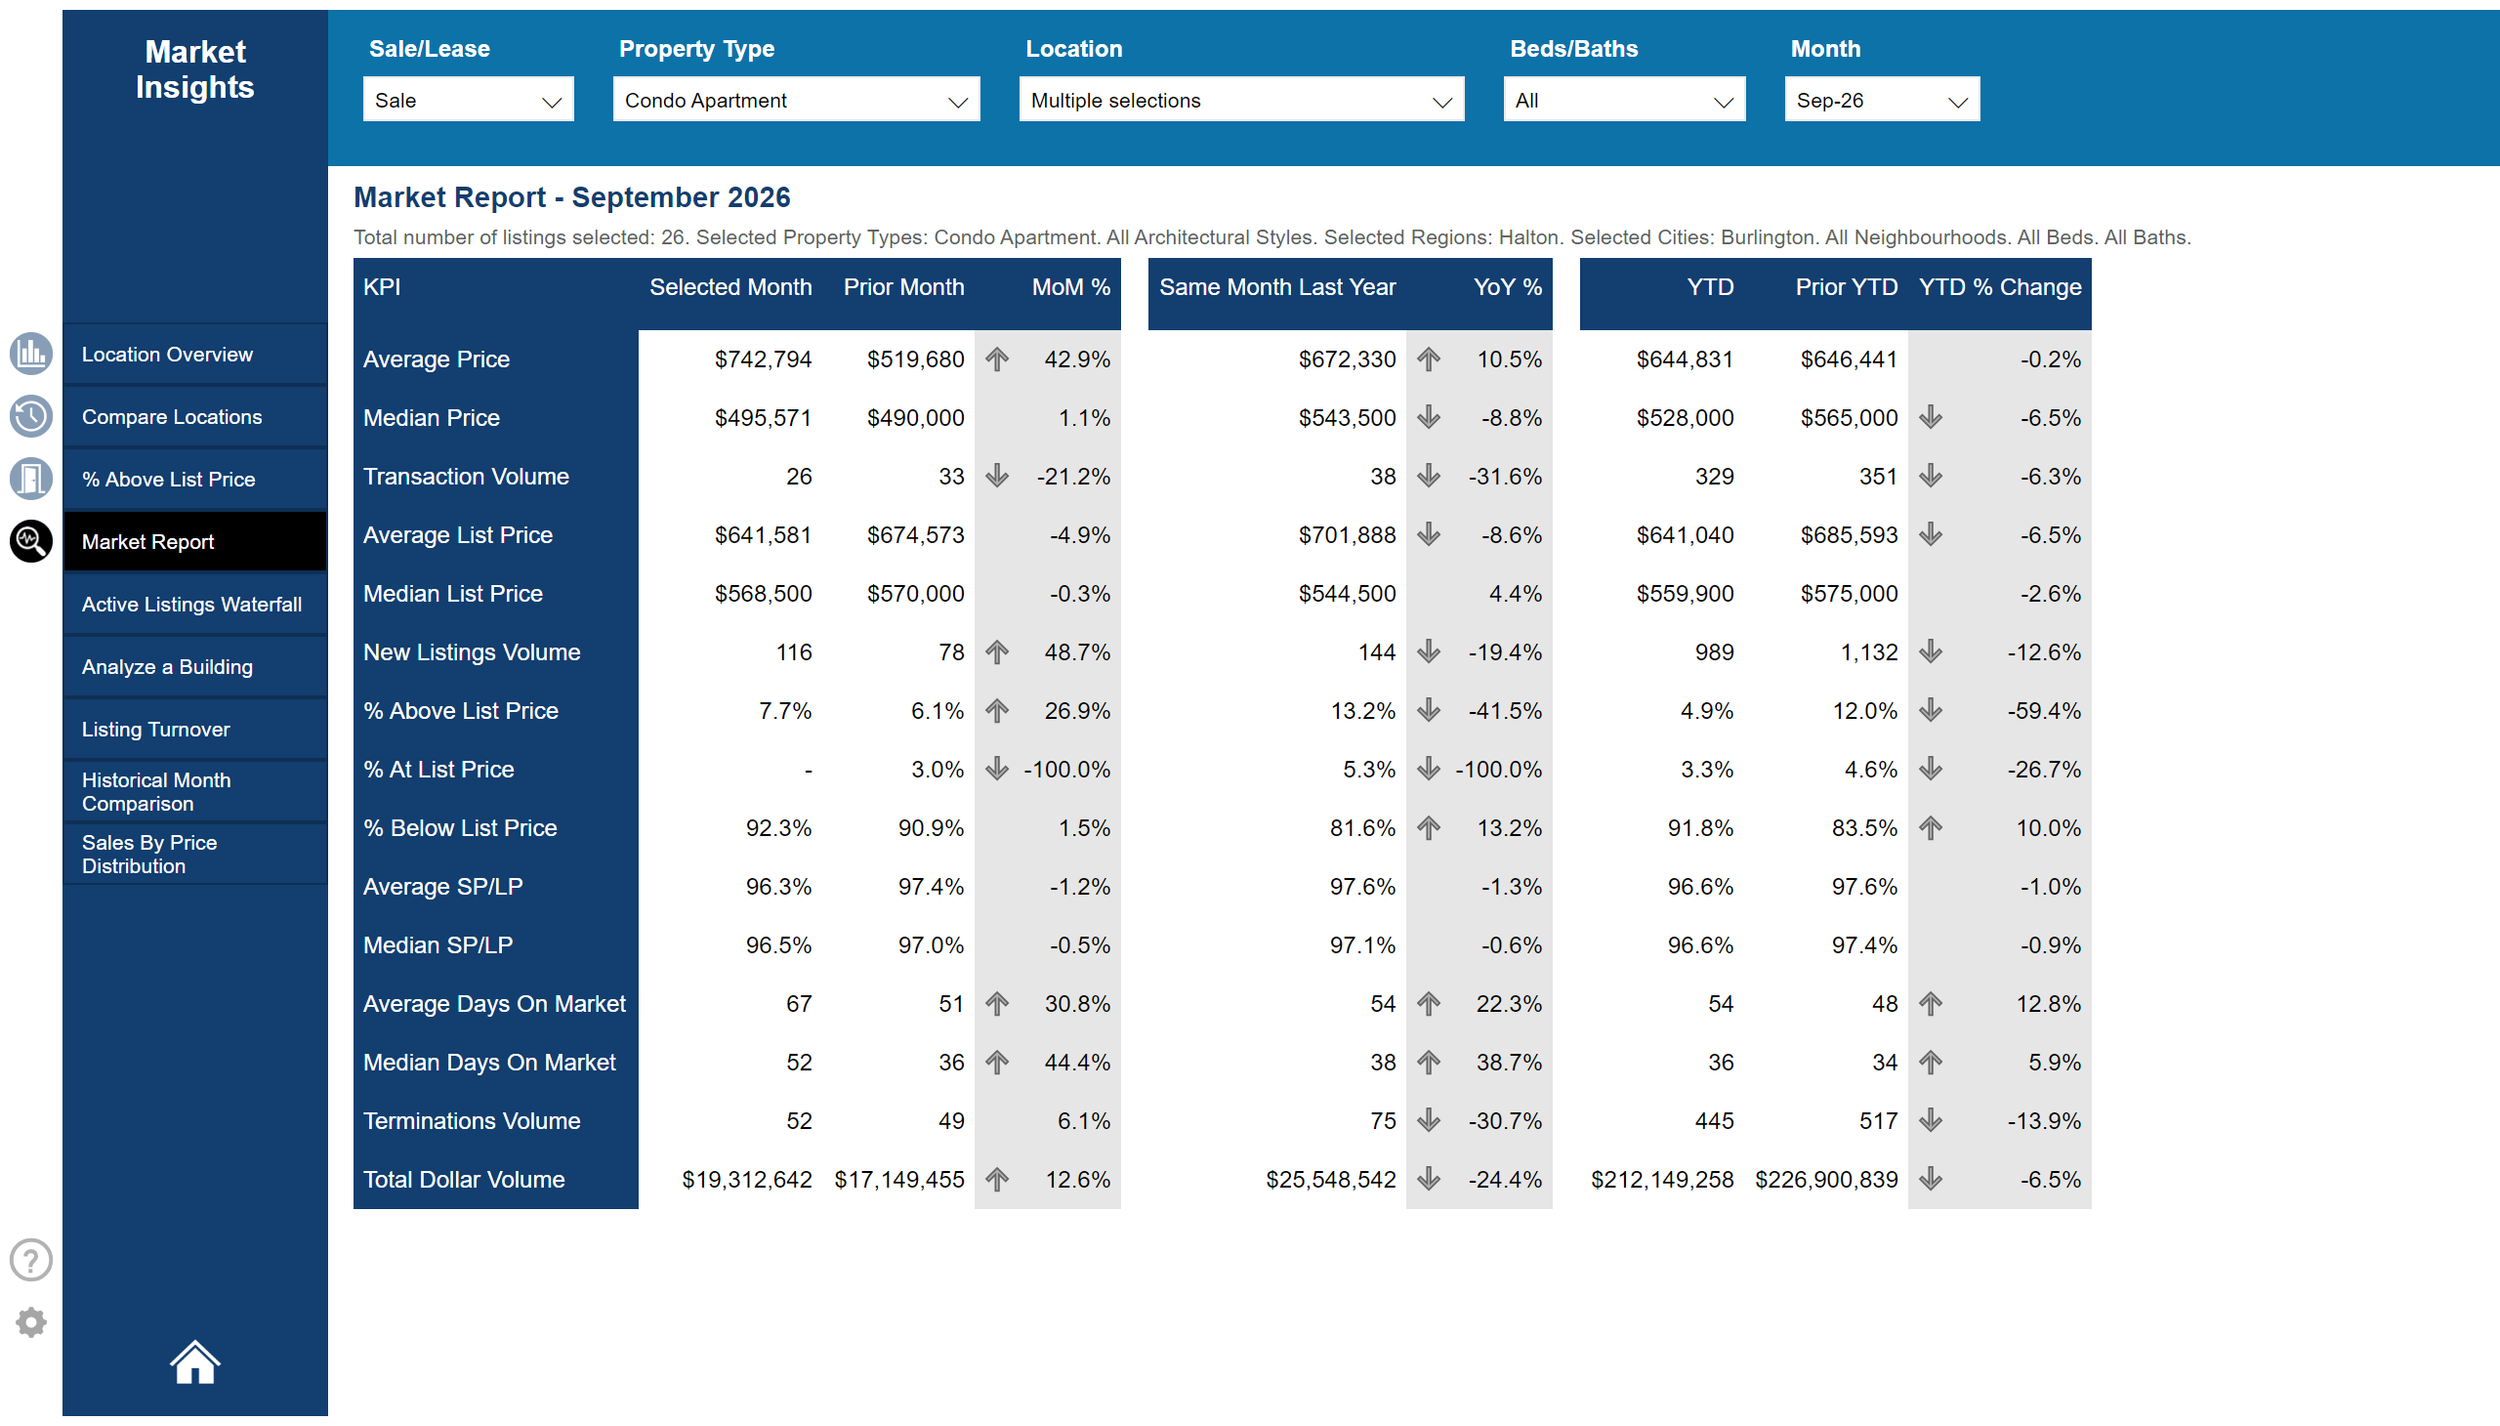
Here are Burlington’s September 2026 sold prices, listings and benchmark prices, broken down by property type.
Sold prices by property type

Citywide in September 2026: average sold price $1,033,458, median sold price $880,000, 177 total sales, benchmark price $840,600.
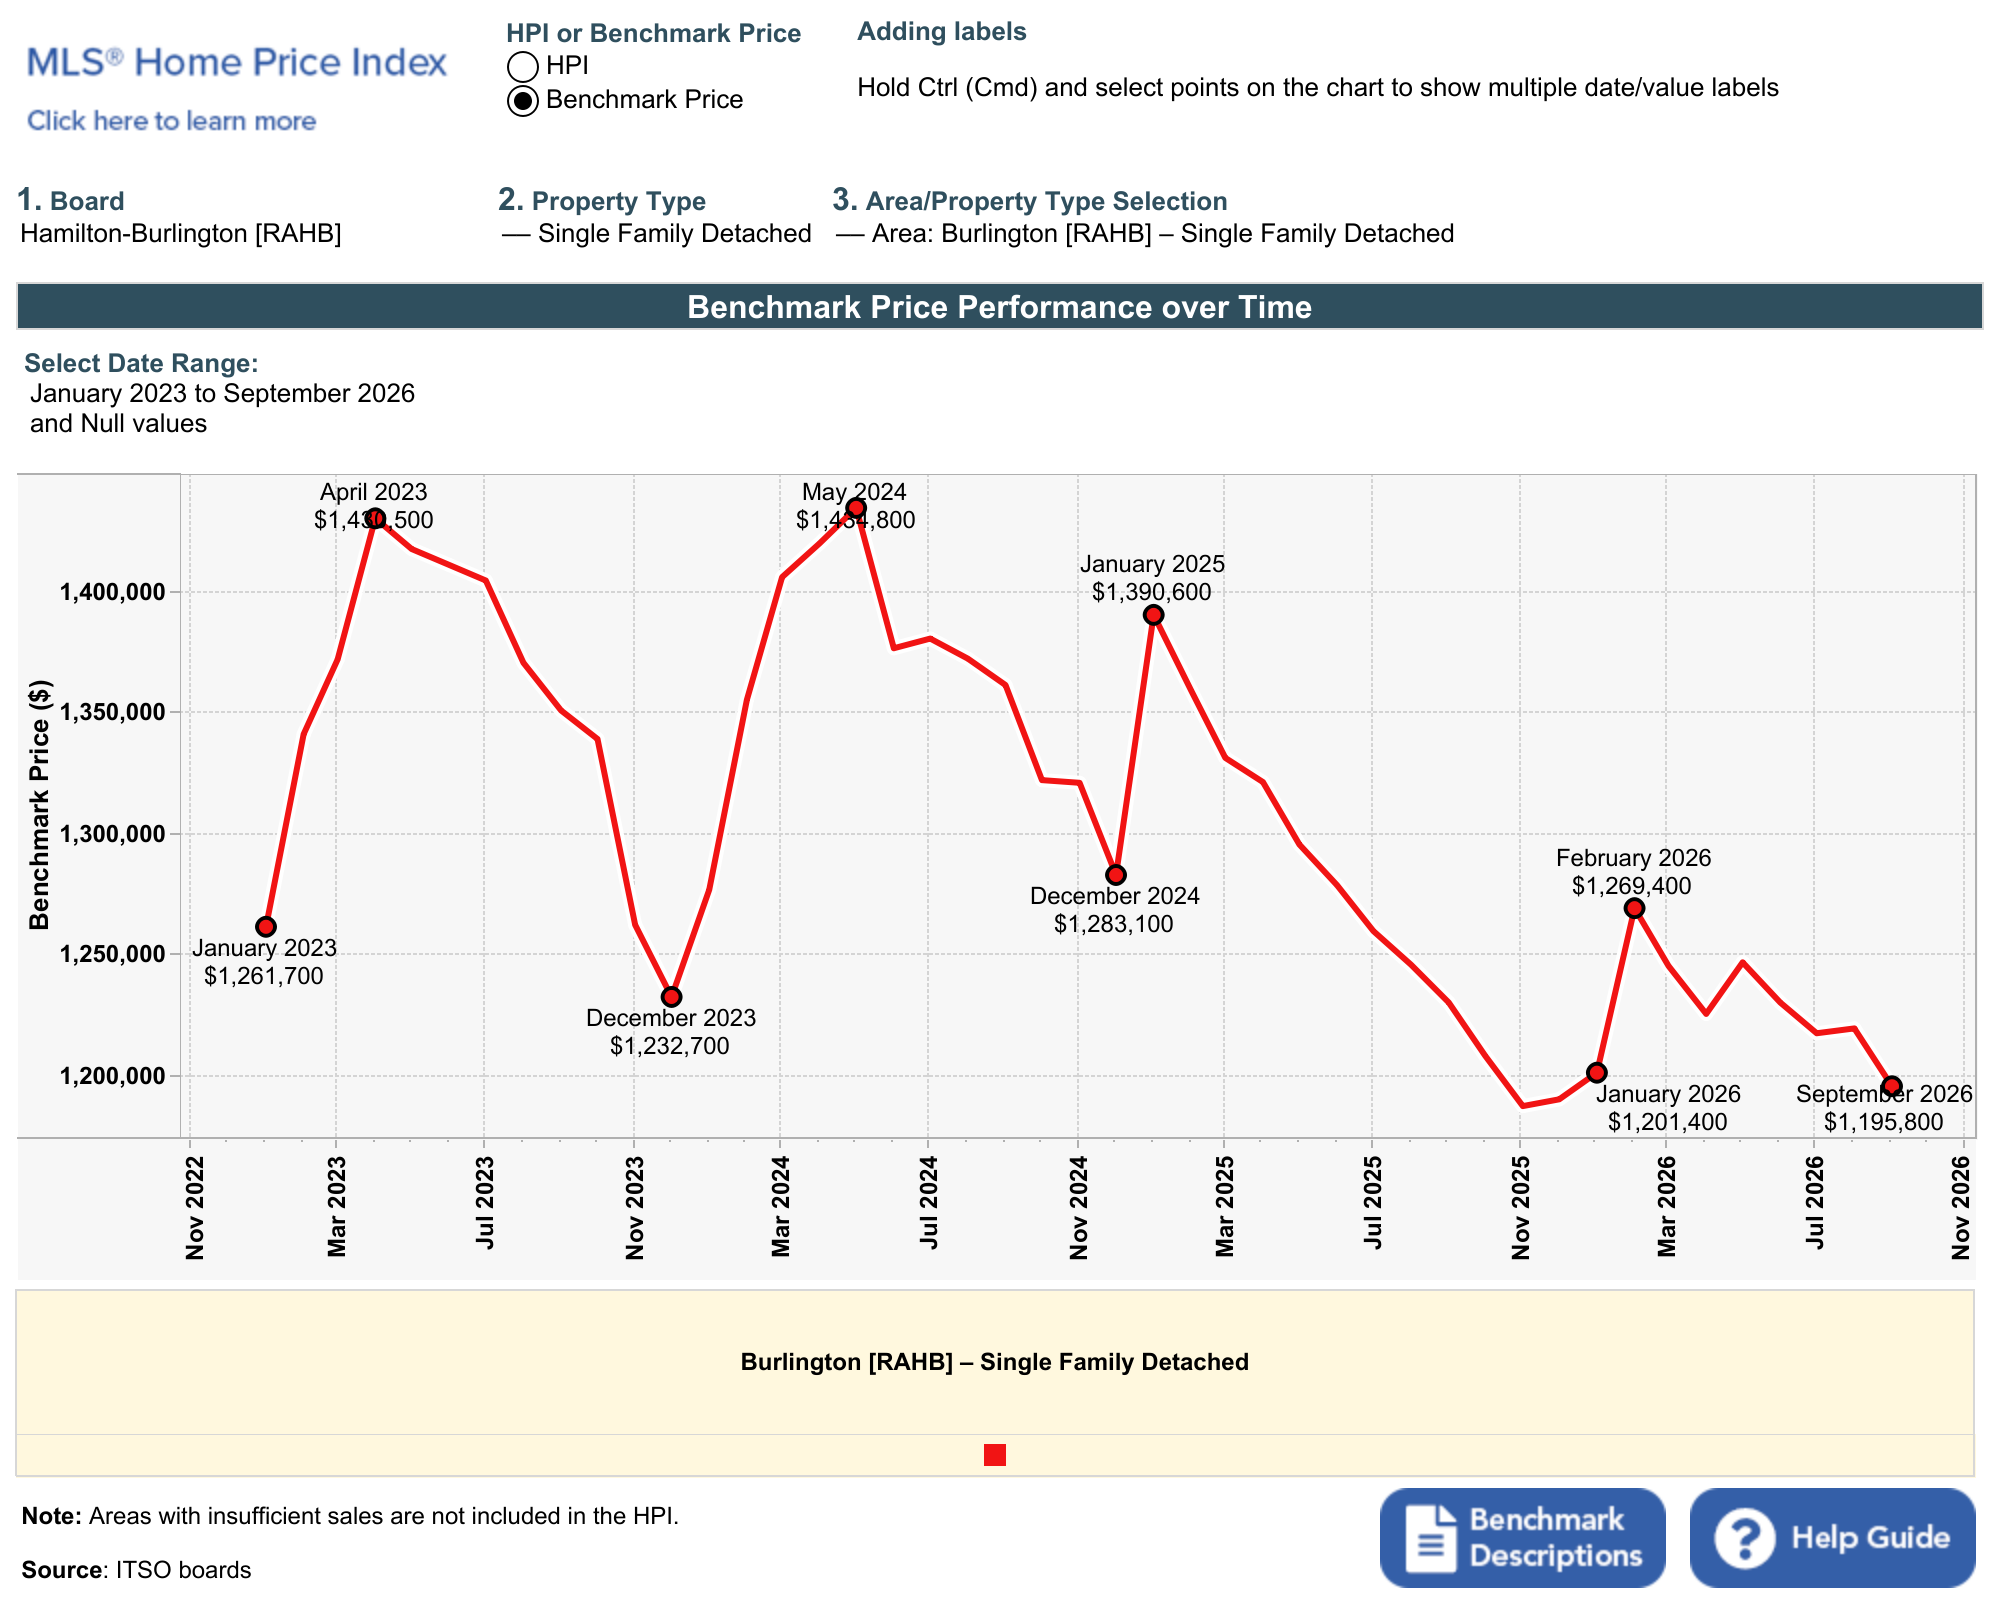
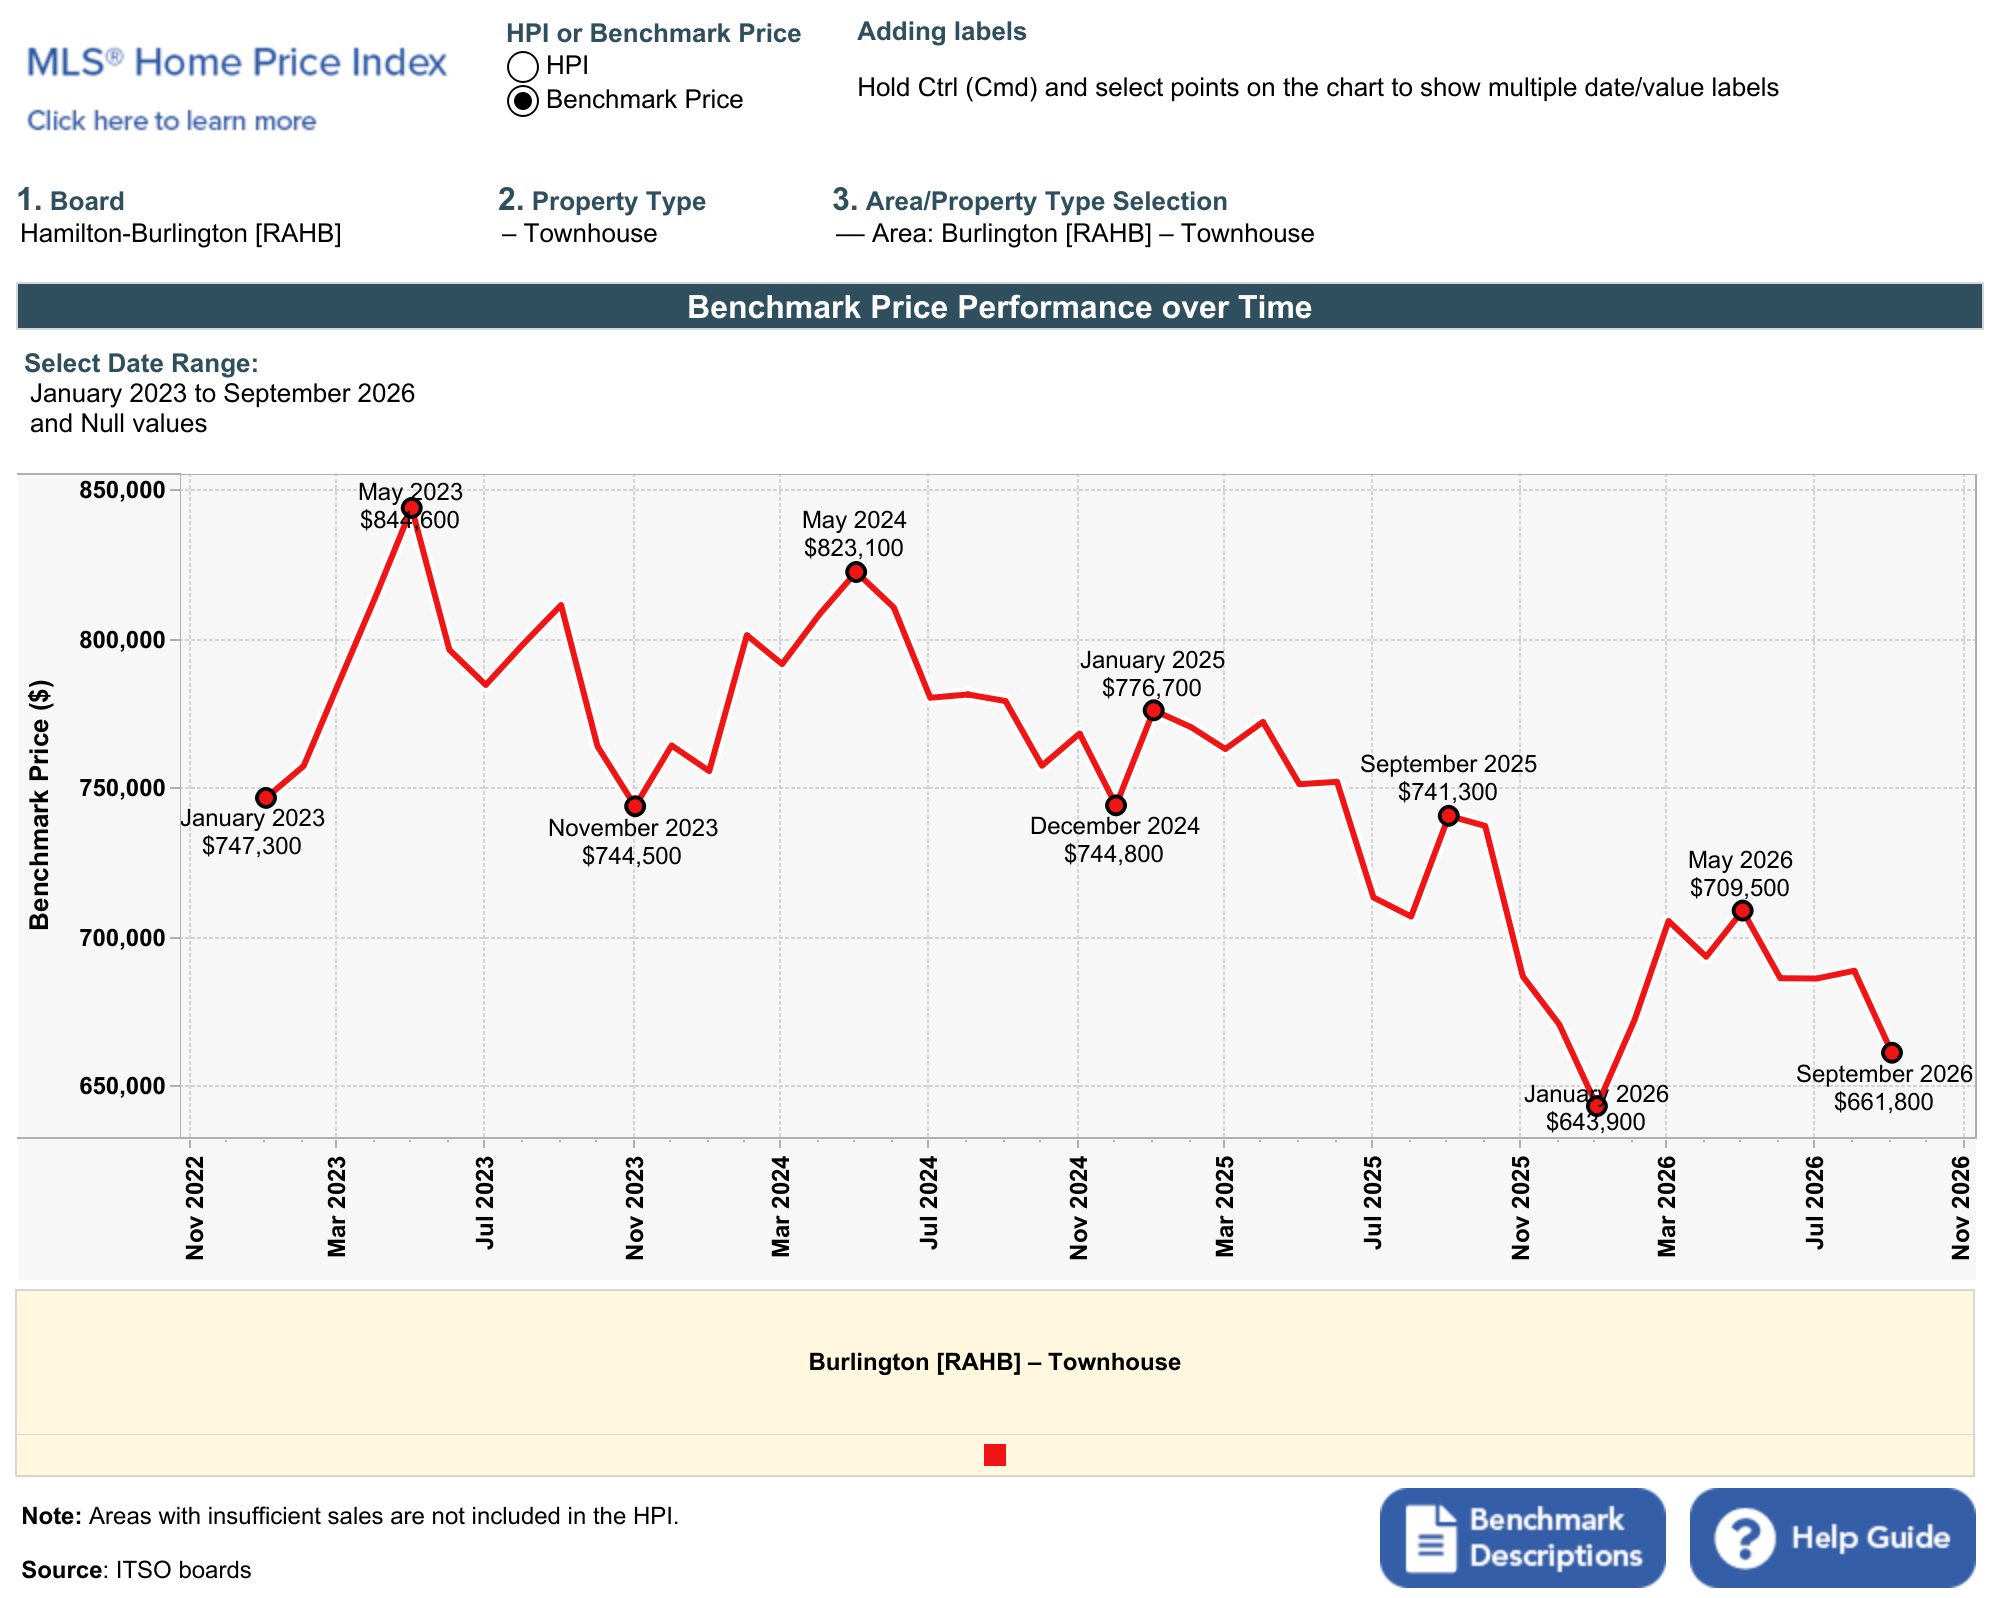
The benchmark price is the estimated value of a typical home in the area. Because it describes a typical home, it changes less than the average does from month to month. It’s a great way to see and follow the trend.
Detached homes: a closer look
Sold in September 2026
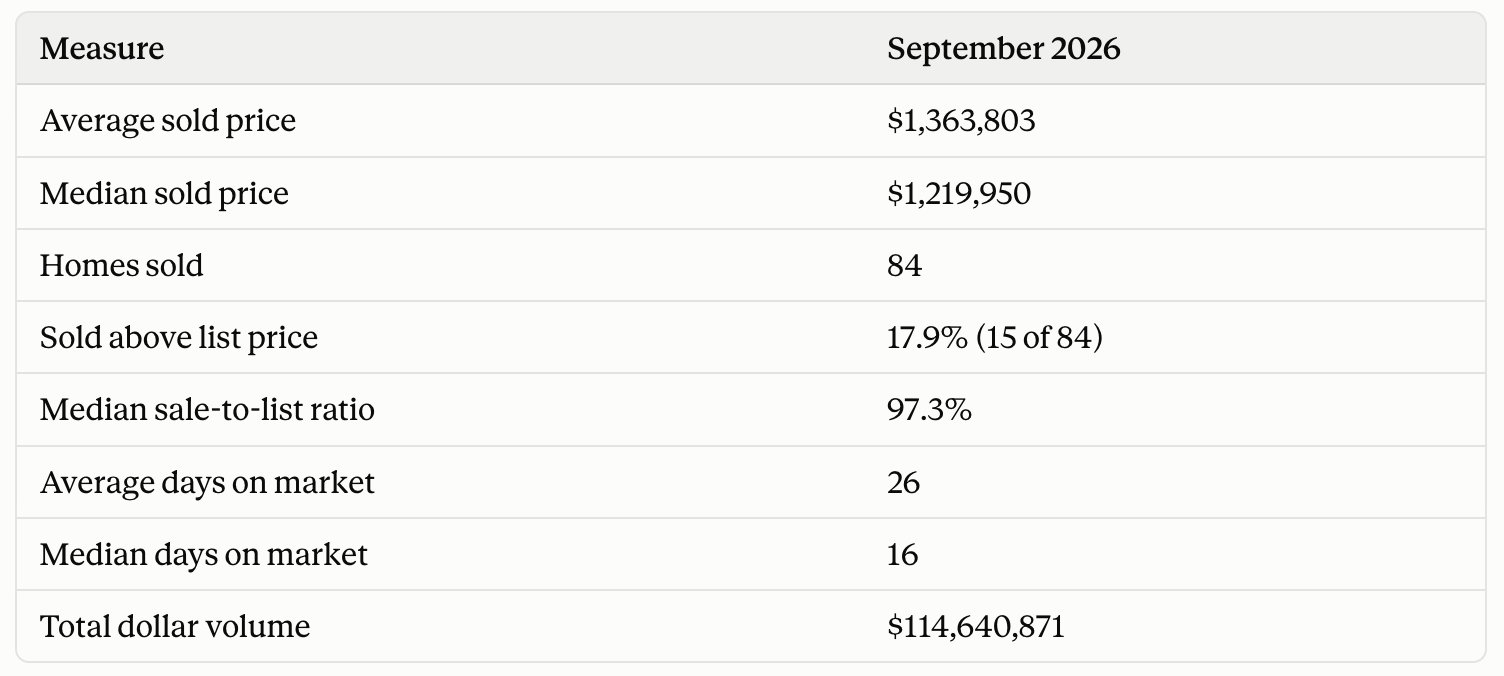
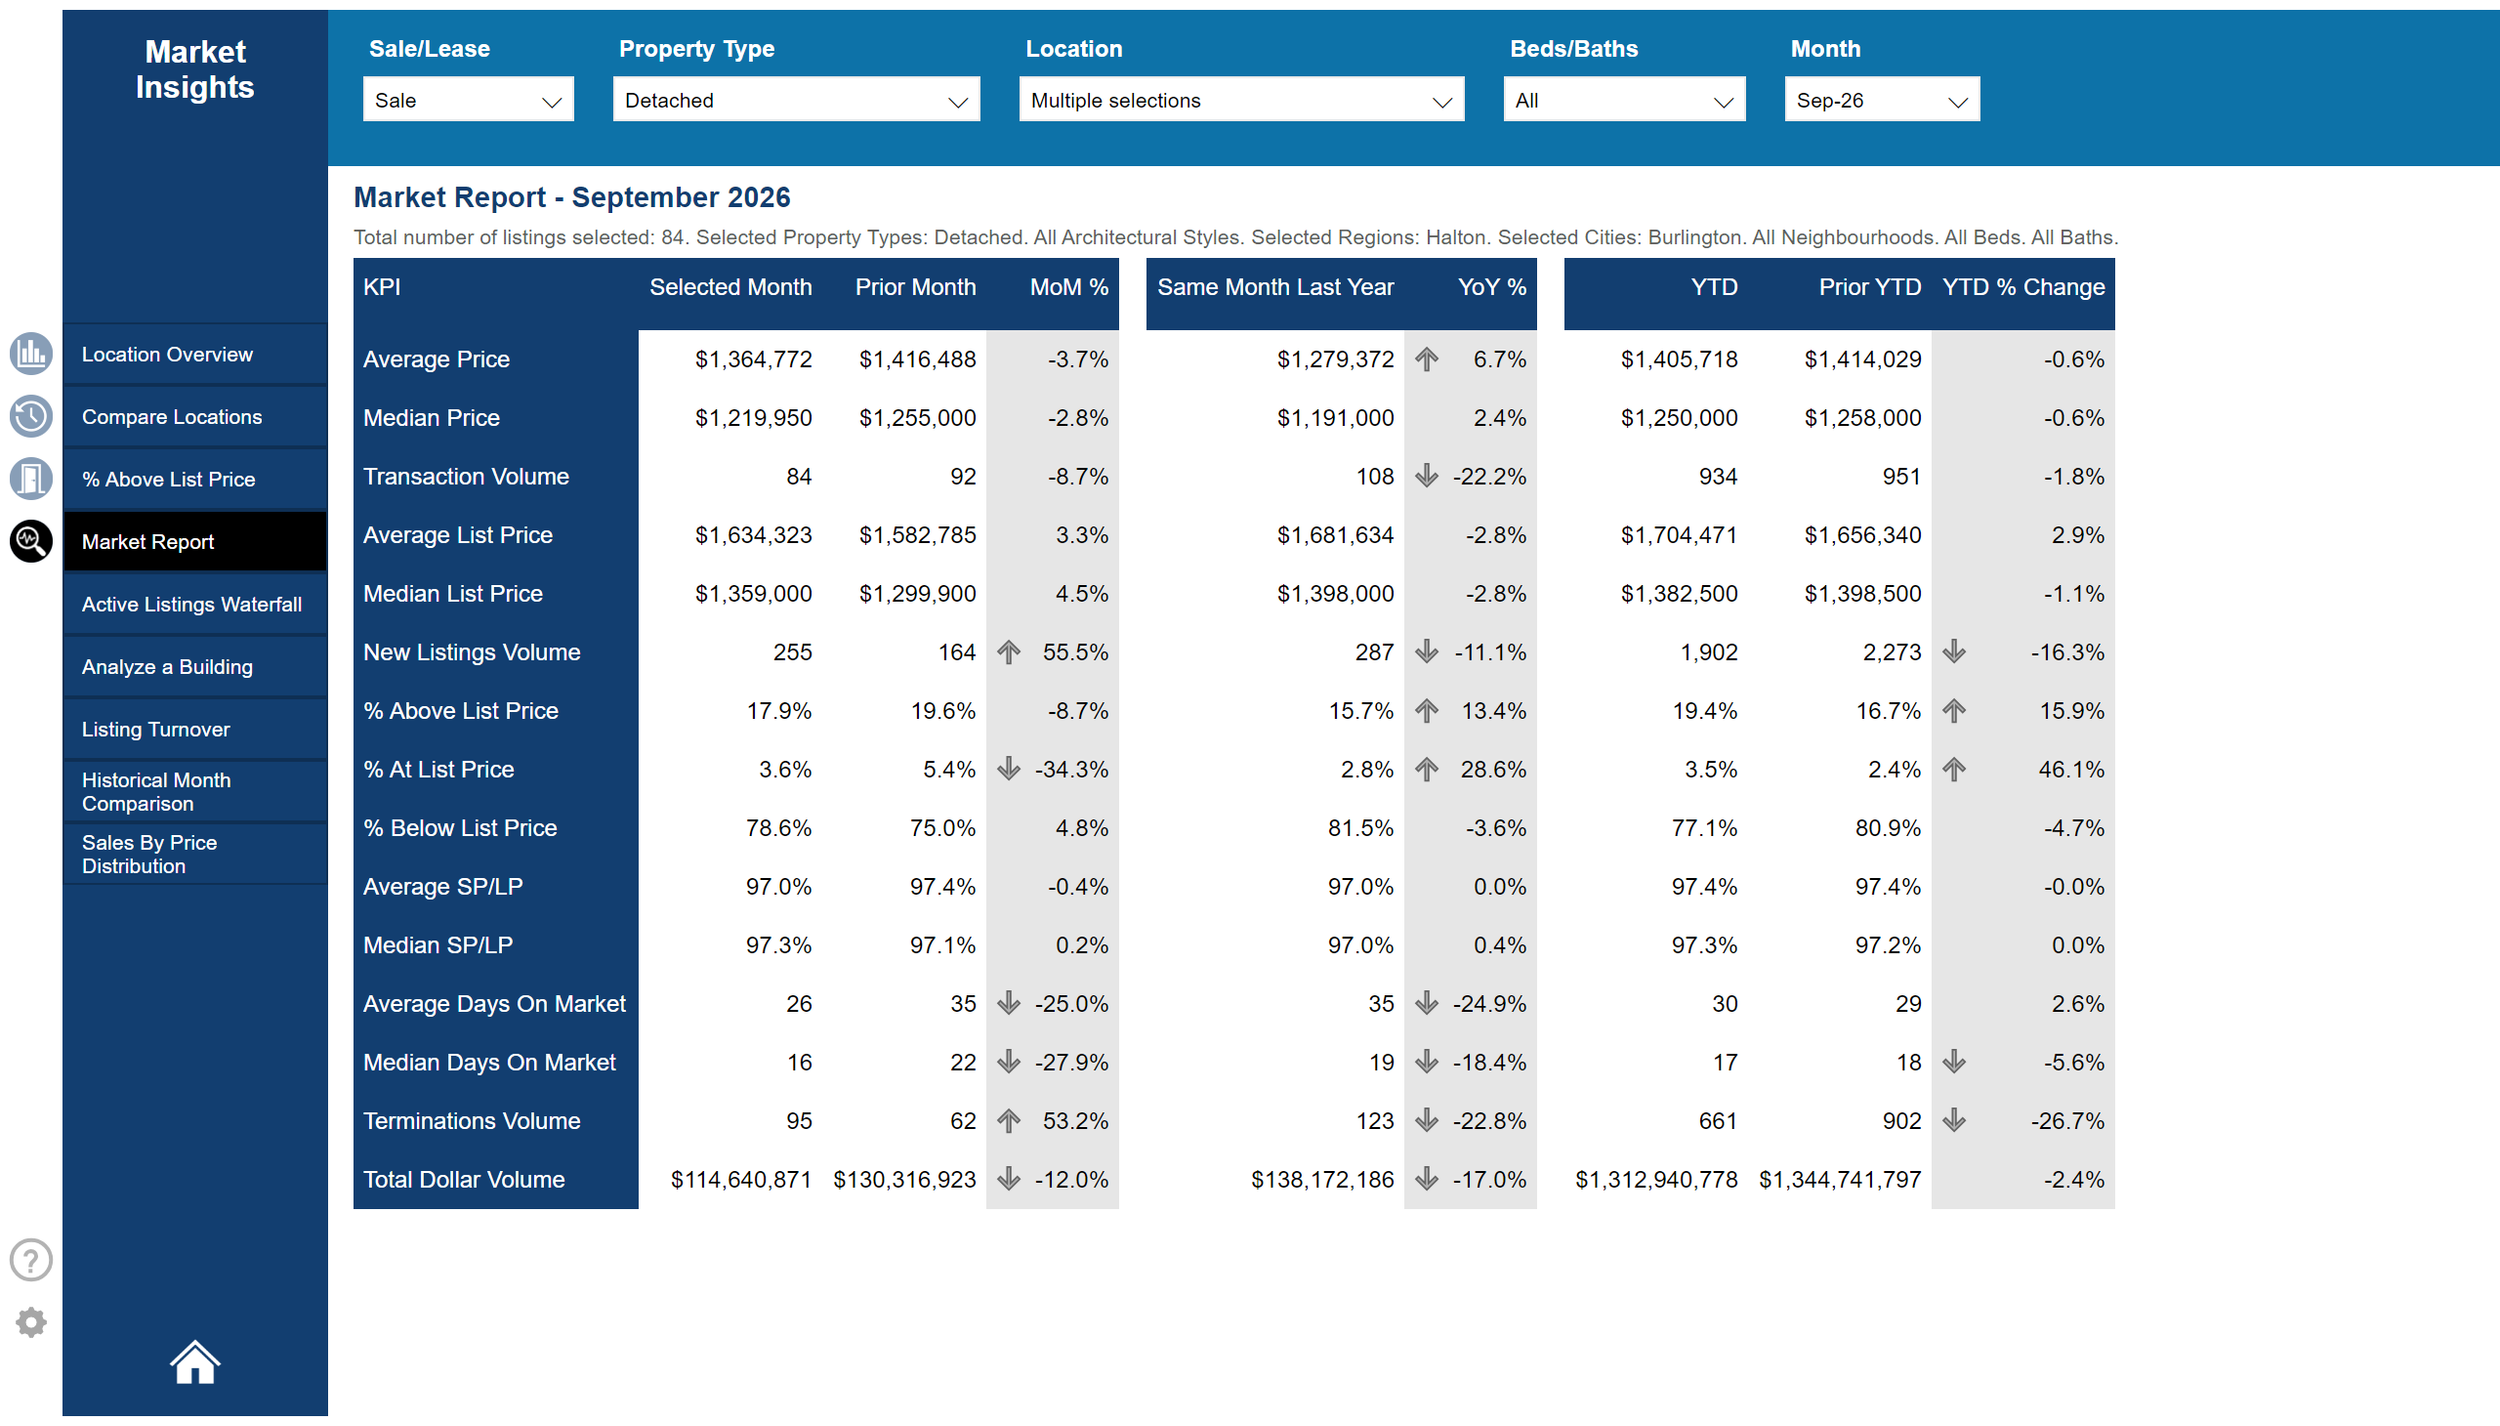
The sale-to-list ratio is the sold price as a percentage of the list price. At 97.3%, a home listed at $1,000,000 would sell for about $973,000. Median days on market fell to 16 in September, down from 22 in August 2026. Sellers listed 255 new detached homes in September, up from 164 in August.
Listings
Burlington had 292 active detached listings. Of those, 144 came on the market between September 1 and 30, 2026.
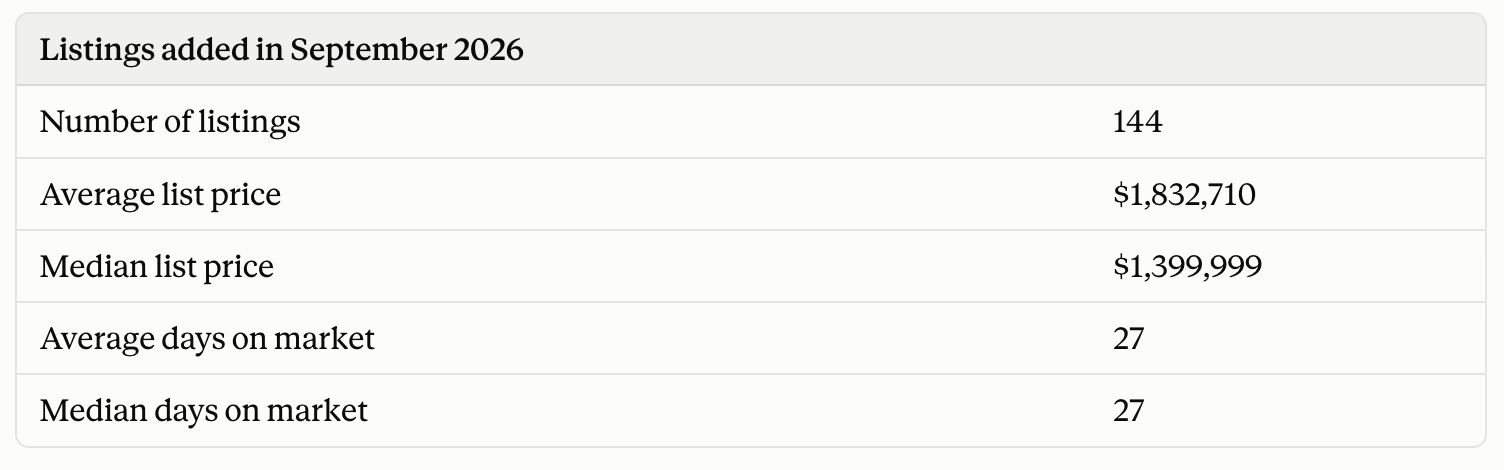
The average list price is well above the average sold price. That is because 32 of the 144 new listings are priced at $2 million or more.
Where buyers are shopping
These are the price points with the most listings added between September 1 and 30, 2026.

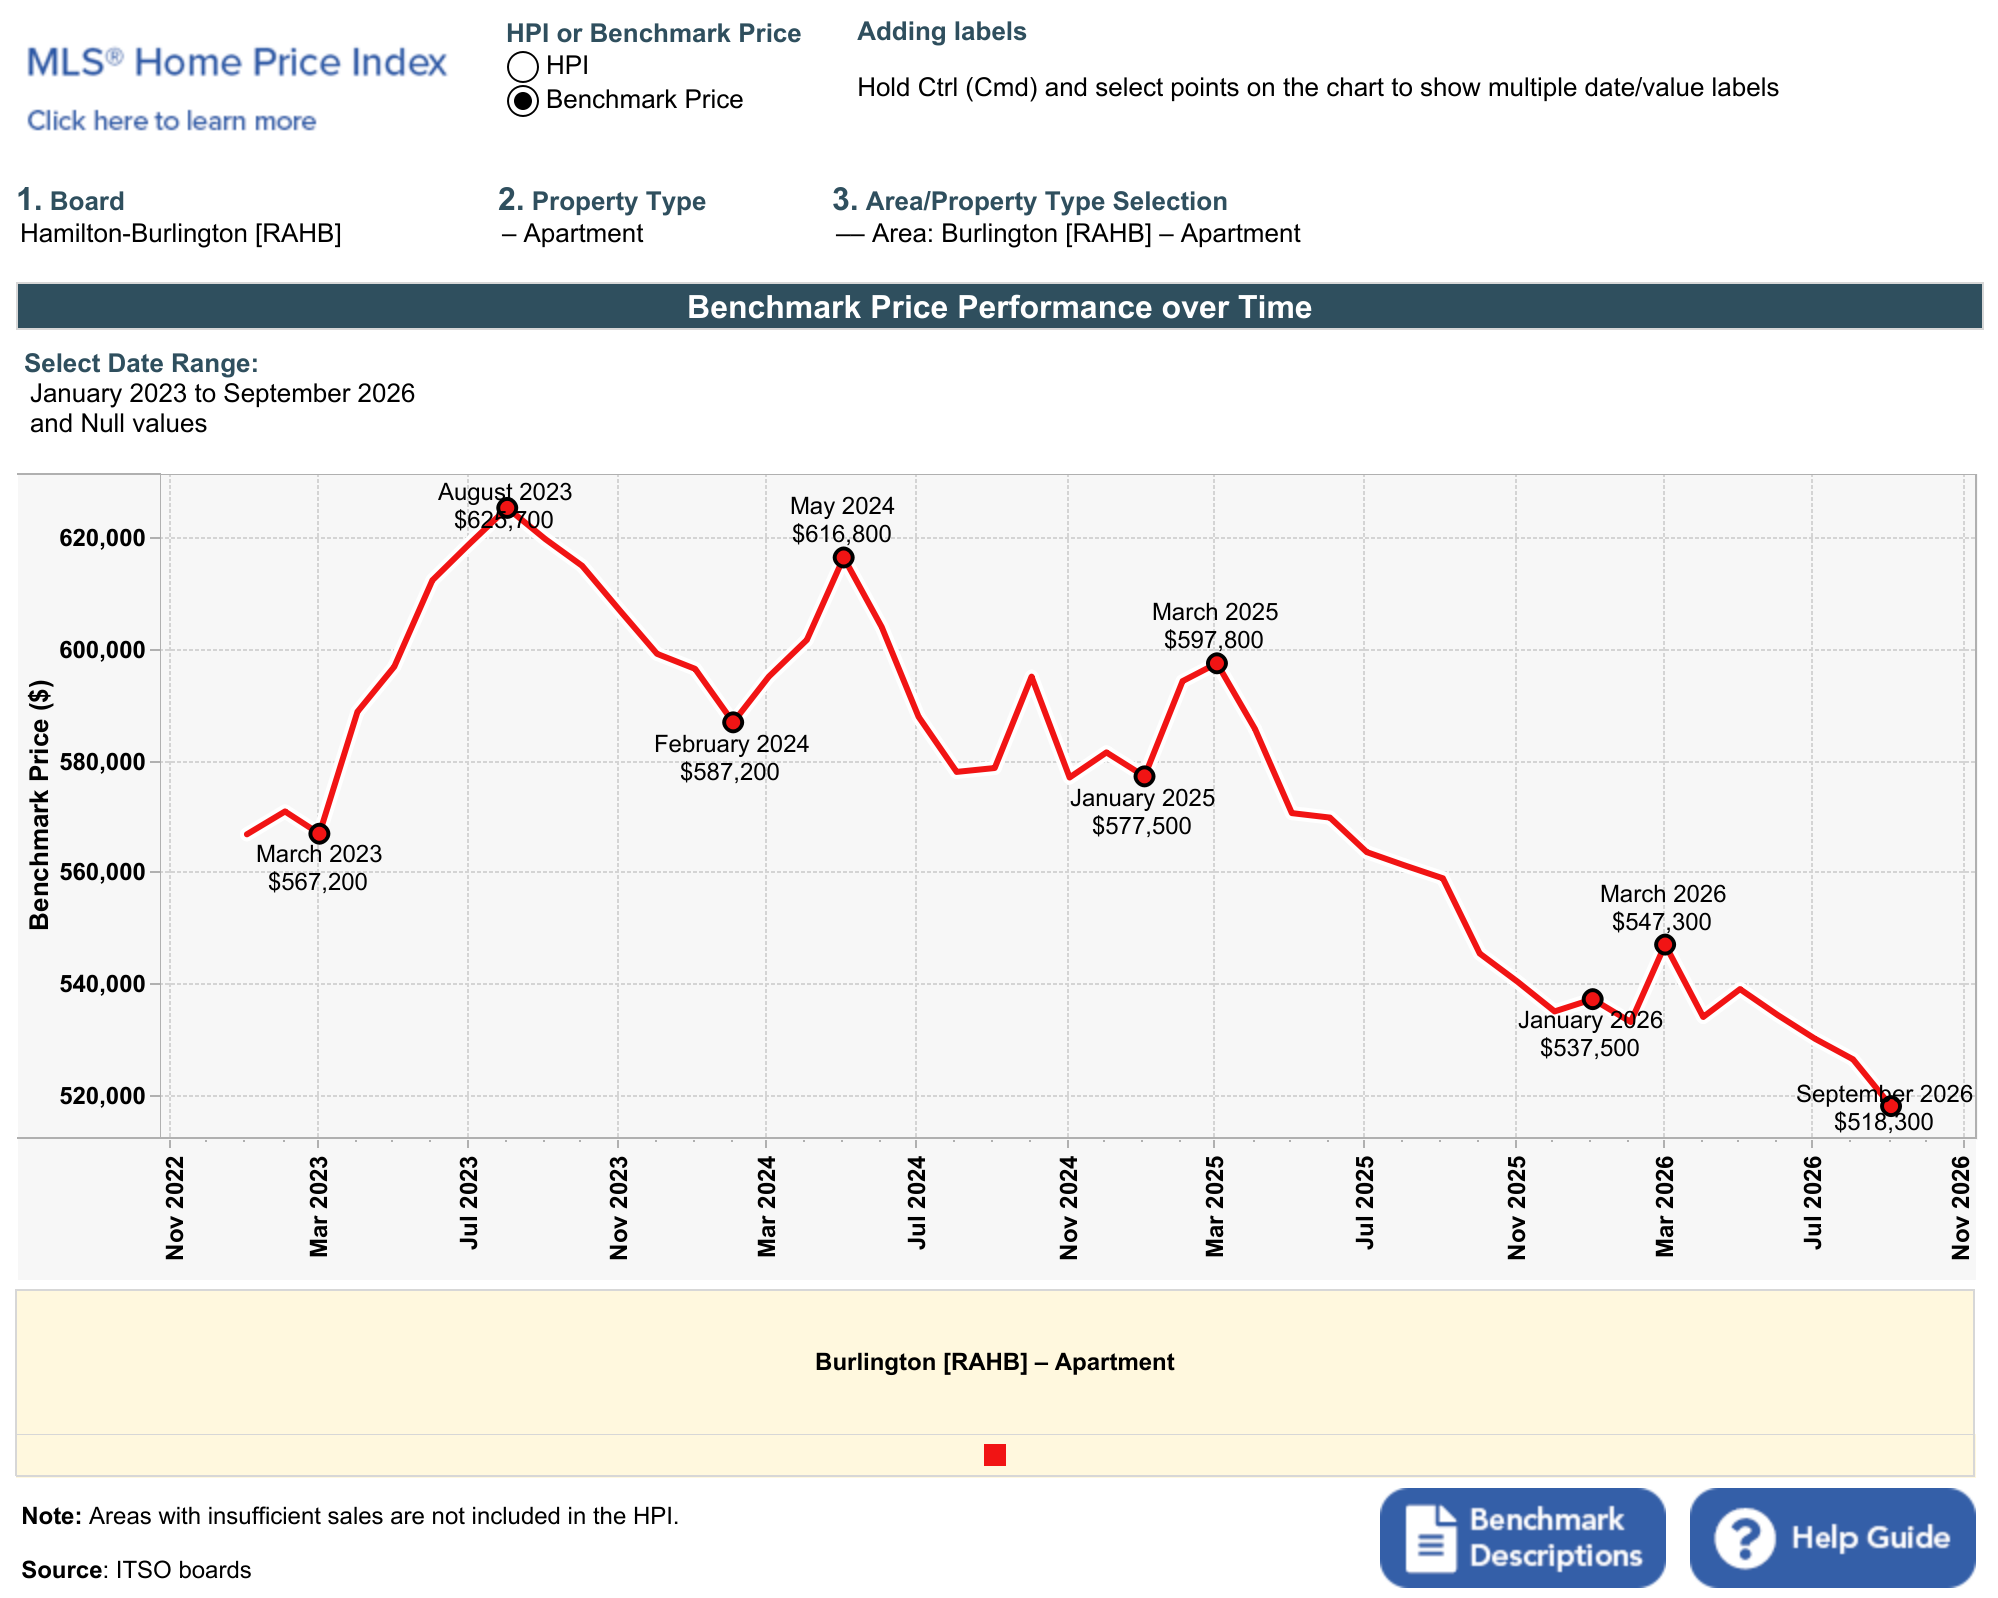
Benchmark prices vs. earlier reference points
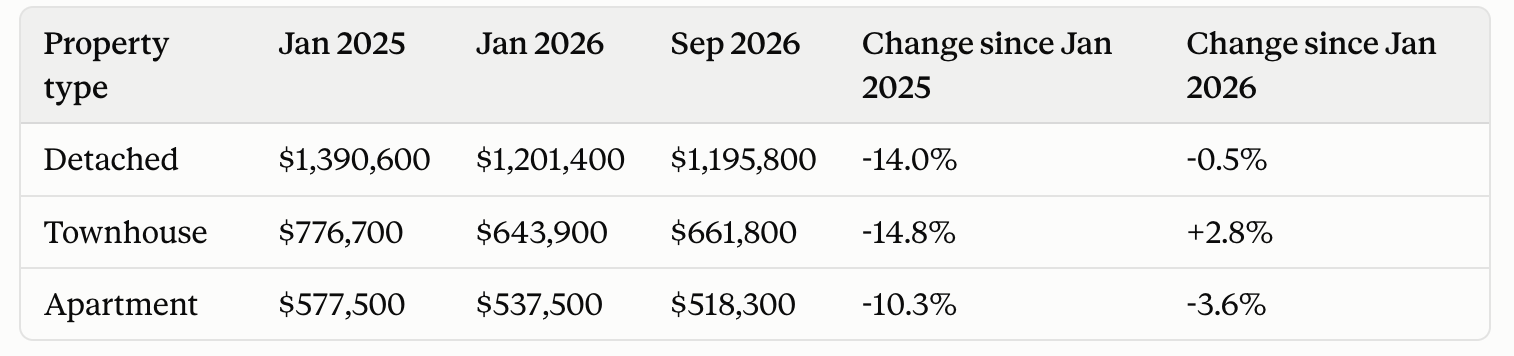
Here are a few plotted points to show the pricing trend after the 2022 boom.
Median vs. average
The median is the middle sale: half of homes sold for more and half sold for less. The average can be pulled up by a few high-priced sales. In September 2026, Burlington’s citywide average of $1,033,458 was $153,458 above the median of $880,000. For detached homes, the average of $1,363,803 was $143,853 above the median of $1,219,950.
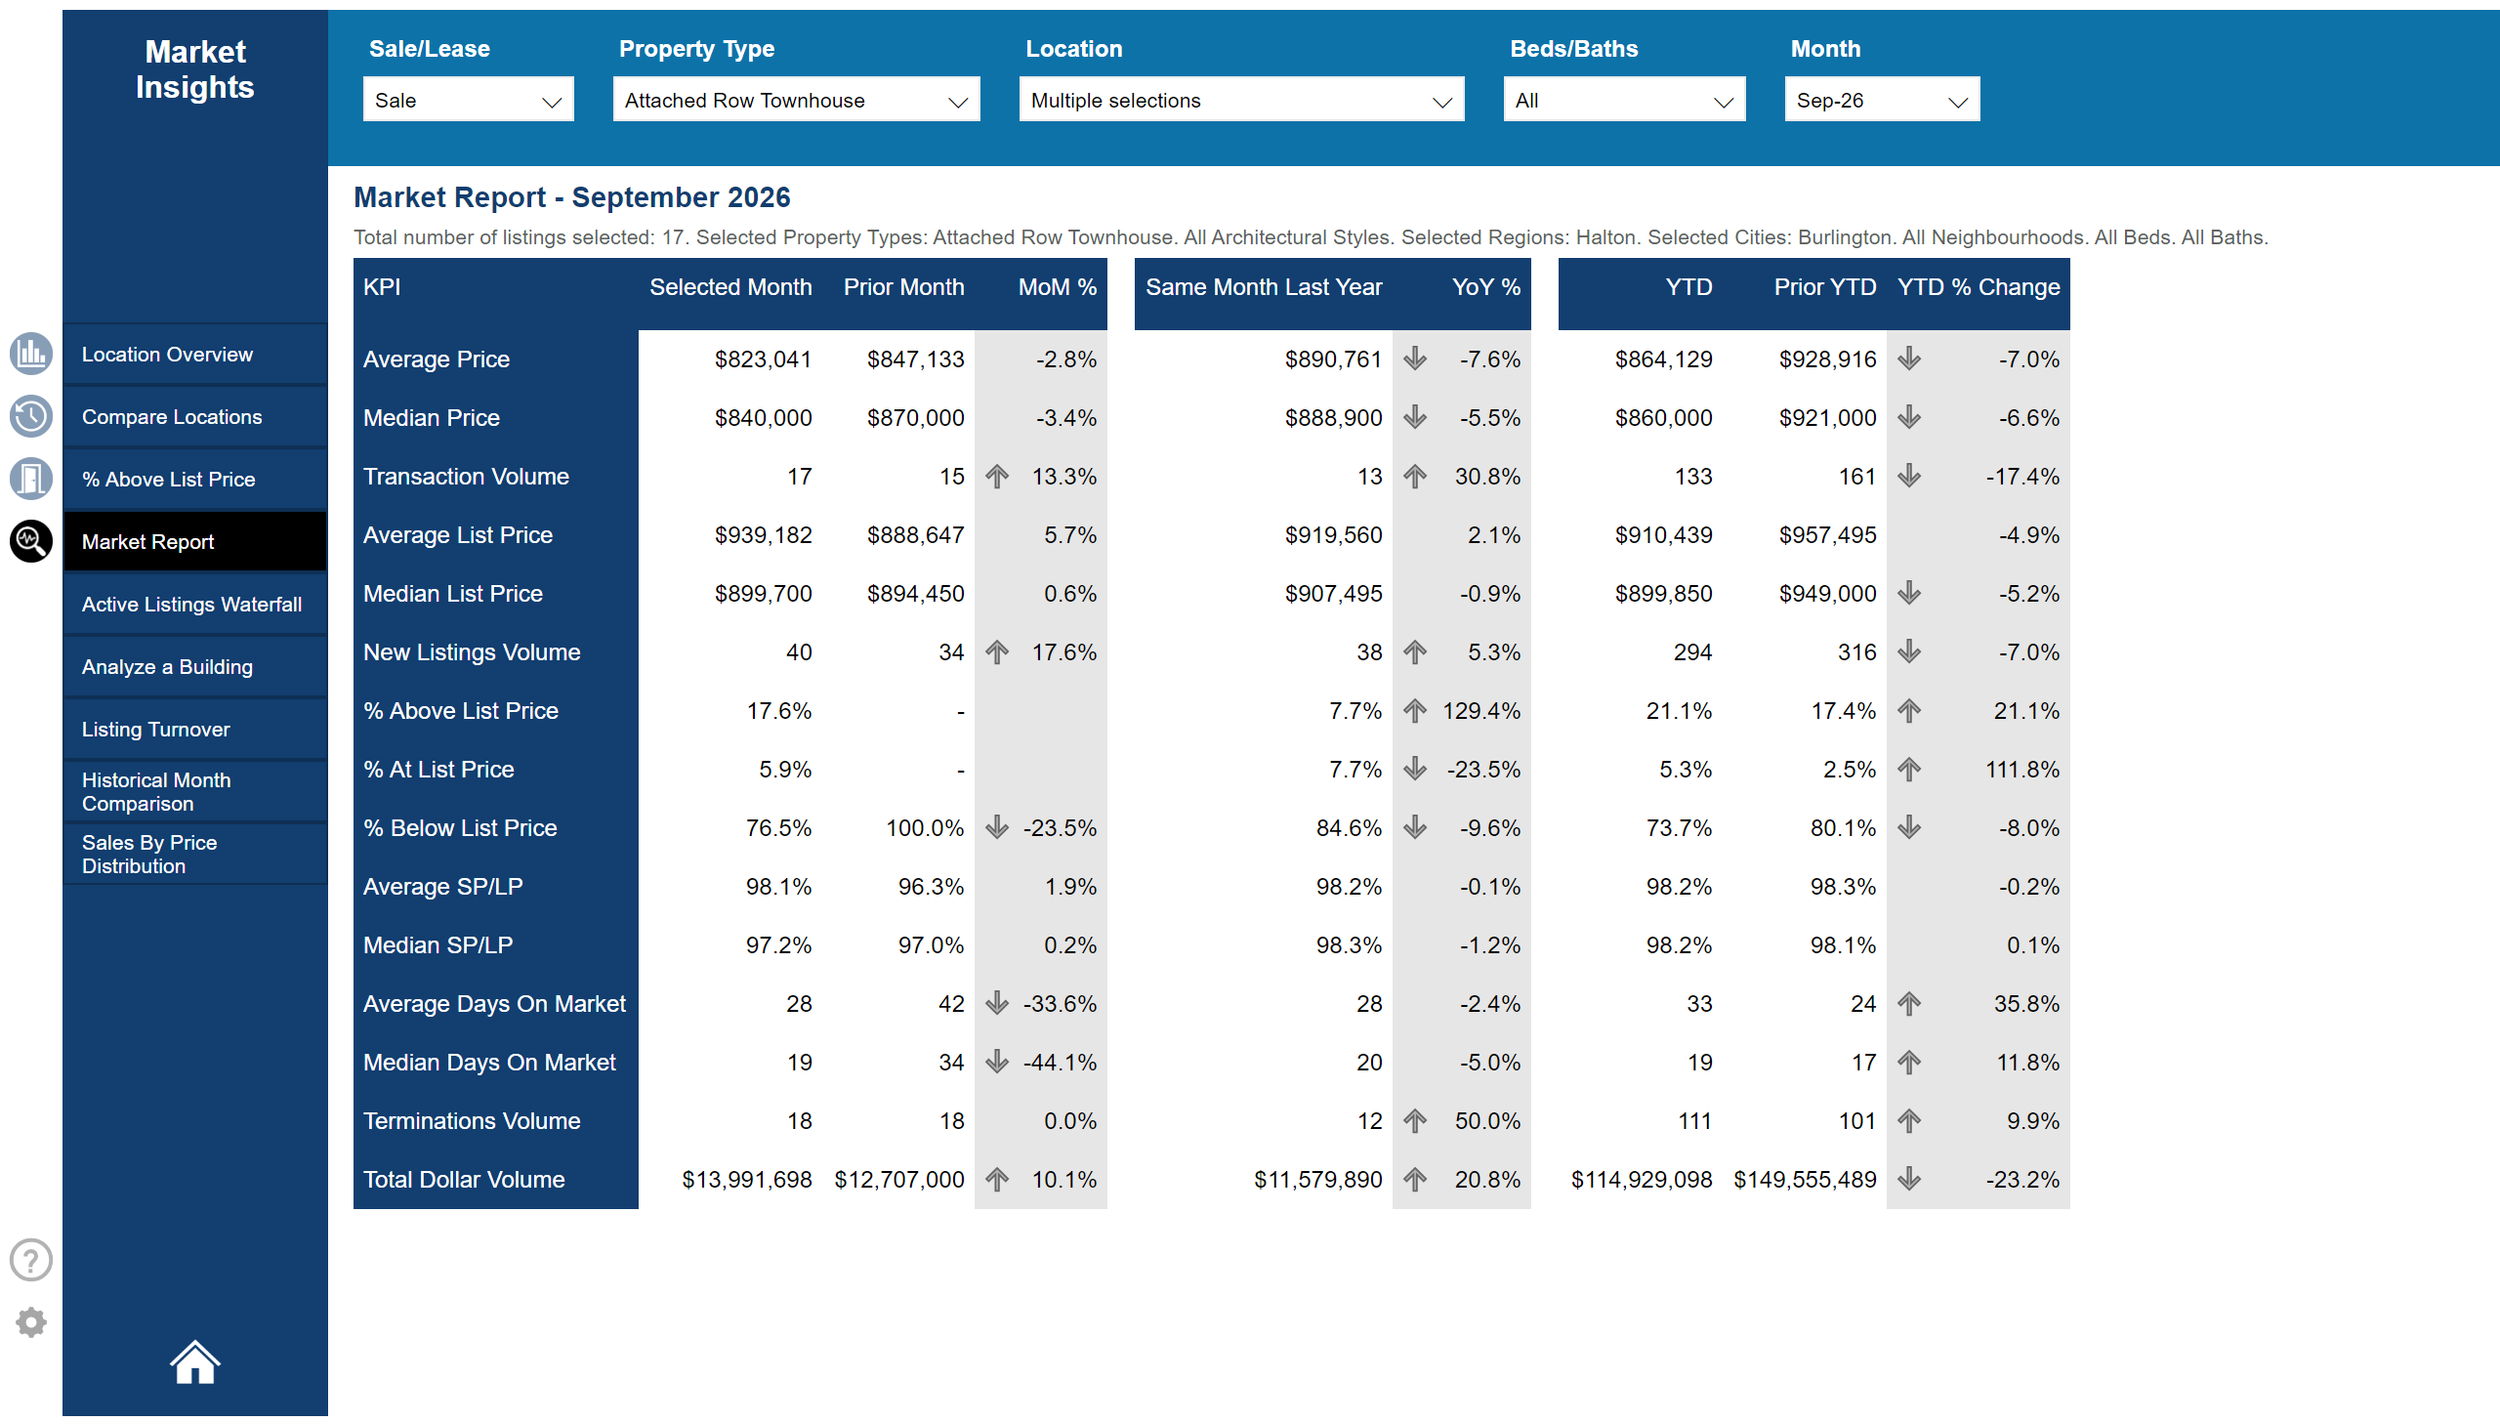
Semi-detached homes had 7 sales and townhouses had 17 in September. With that few sales, one or two homes can noticeably change the average from one month to the next.
What this means for you
Citywide numbers don’t tell you what is happening on your street or what your home is worth. If you would like, I can pull the September numbers for your neighbourhood or your home. Reach out any time at mclellanrealestate.ca.
Price It Right and Show It Well™
Andrew Mclellan
Sources: WOWA.ca Burlington Housing Market Report, updated October 6, 2026; Habistat Market Insights and Active Listings, Burlington, September 2026; MLS® Home Price Index, Hamilton-Burlington (RAHB) board area.
